One system for instant ICT backtesting and automated live analysis.
Backtest your strategy on over a decade of data in seconds. Then get alerted every time it sets up live. Lifetime access to both.
One-time payment.
Backtesting Platform New
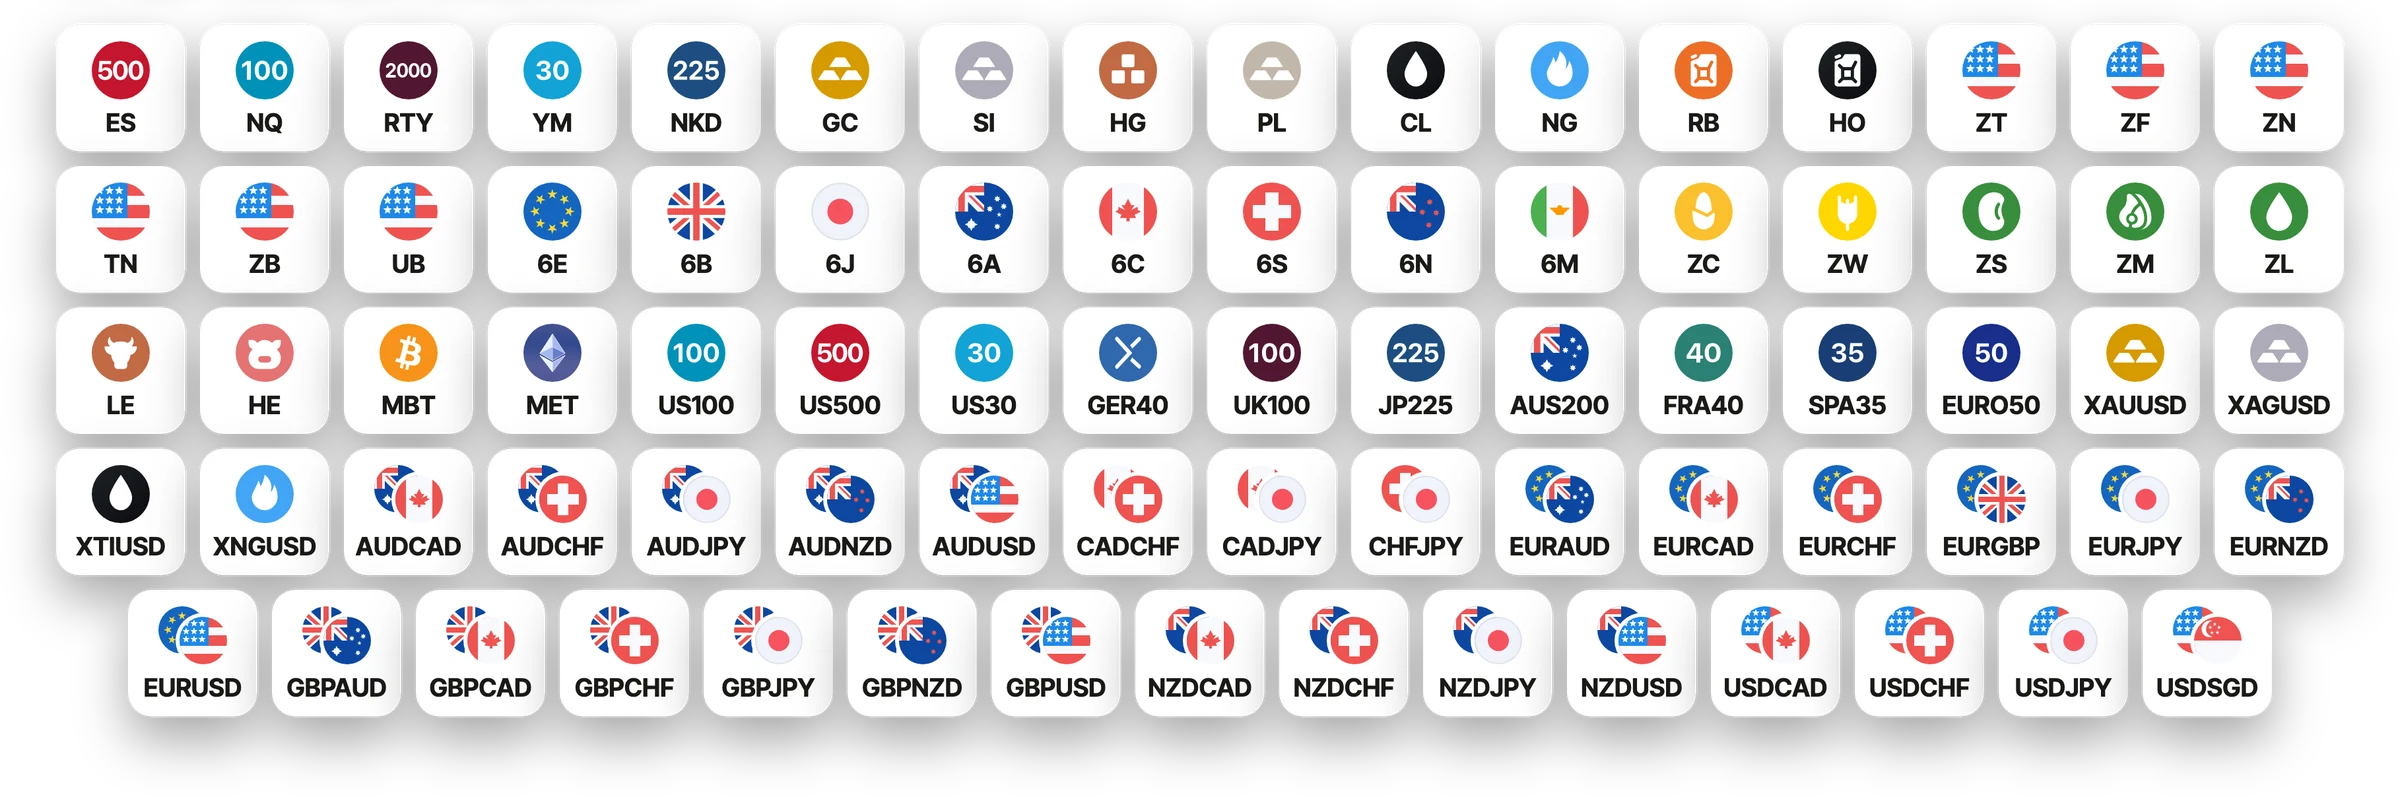
Backtest your exact strategy in seconds, on up to 16 years of futures data and 22 years of forex and CFDs.
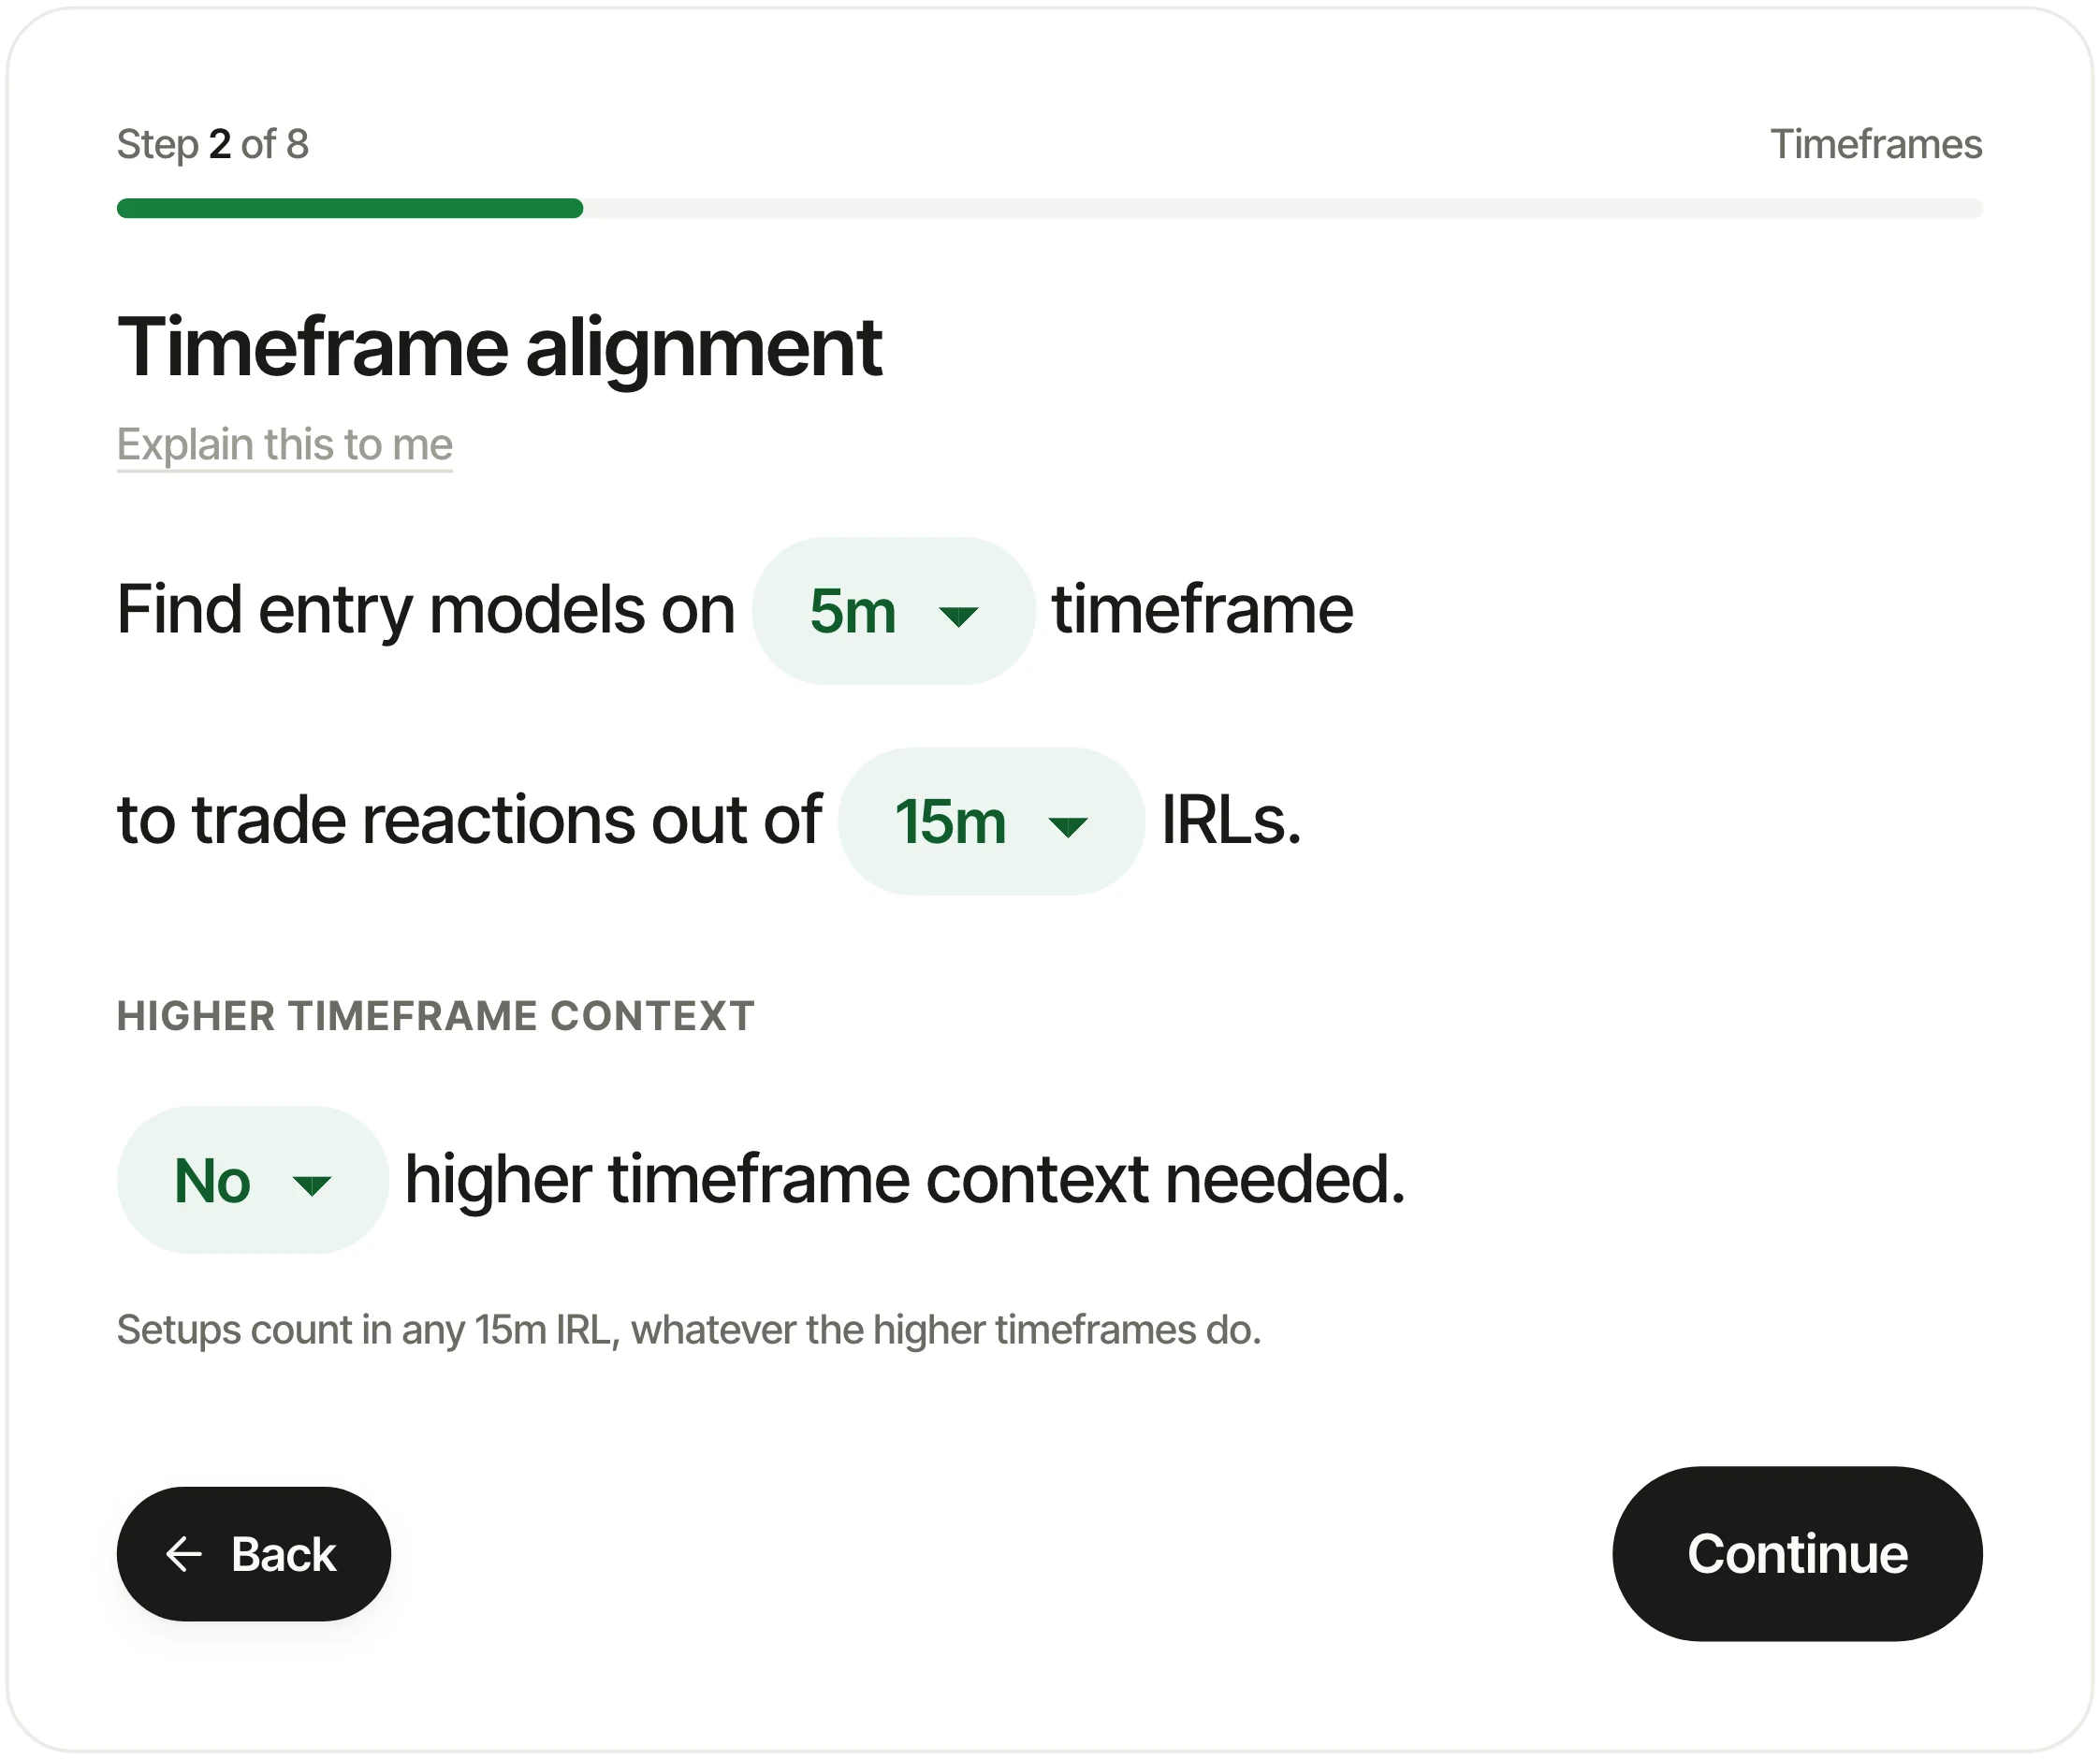

Build your strategy
Pick a market and answer a few questions about how you trade it.


Click Backtest. It runs in seconds.
It finds every setup your strategy would have taken over the full history and simulates every trade.
See why it worked
See which parts of your strategy work: results by side, entry model, hours and weekdays.

See every month and every year
The result of every month since 2010, and how many months each year ended up or down.
Months and years
The result by the month the trades closed in, as the account grew in percent.
| Jan | Feb | Mar | Apr | May | Jun | Jul | Aug | Sep | Oct | Nov | Dec | W/L months | Year | |
|---|---|---|---|---|---|---|---|---|---|---|---|---|---|---|
| 2026 | −3.0% | +3.9% | +3.9% | +9.1% | +4.0% | +3.9% | – | +0.9% | −2.0% | – | – | – | 6W 2L | +22.0% |
| 2025 | +11.2% | −2.0% | −2.0% | 0.0% | −1.0% | −1.0% | −1.0% | −1.0% | −1.0% | +2.9% | 0.0% | +6.8% | 3W 9L | +11.5% |
| 2024 | −1.4% | −6.0% | +0.9% | +3.0% | −3.4% | −1.1% | +3.4% | −2.0% | 0.0% | −1.2% | −1.0% | −2.0% | 3W 9L | −10.6% |
| 2023 | −2.0% | −2.0% | – | +3.8% | +6.4% | −3.0% | +9.1% | +8.1% | −0.9% | −3.3% | +36.7% | −4.9% | 5W 6L | +51.1% |
| 2022 | −3.9% | – | – | +31.5% | +6.0% | −3.0% | −1.1% | −1.0% | −3.1% | +0.9% | −0.4% | +0.8% | 4W 6L | +24.9% |
| 2021 | +3.9% | +17.0% | −1.0% | −3.0% | −2.1% | −2.0% | 0.0% | +10.1% | 0.0% | 0.0% | −1.0% | – | 3W 8L | +22.0% |
| 2020 | −2.0% | −2.1% | 0.0% | +2.9% | −2.0% | −0.1% | 0.0% | −1.0% | – | – | −4.0% | −0.1% | 1W 9L | −8.2% |
| 2019 | 0.0% | −2.1% | −3.0% | +16.8% | −1.0% | 0.0% | +6.0% | −2.1% | +1.9% | +1.7% | −1.0% | −1.1% | 4W 8L | +15.6% |
| 2018 | −3.1% | – | +6.0% | +2.0% | −5.1% | −2.1% | 0.0% | −6.1% | −1.1% | −1.0% | −3.0% | +12.4% | 3W 8L | −2.6% |
| 2017 | +21.4% | +0.5% | +2.7% | +1.7% | +3.5% | −1.0% | −3.0% | +2.9% | −7.1% | +8.0% | – | +3.5% | 8W 3L | +35.4% |
| 2016 | +2.9% | −0.1% | +8.1% | −1.0% | +2.9% | +3.9% | −2.0% | +12.3% | +4.0% | −3.0% | −2.2% | +16.4% | 7W 5L | +48.5% |
| 2015 | −2.1% | −8.5% | −2.2% | −1.4% | +7.2% | −6.1% | −0.1% | 0.0% | 0.0% | +1.4% | +0.8% | −0.3% | 3W 9L | −11.6% |
| 2014 | −1.1% | +6.8% | −2.2% | −0.4% | −3.4% | −4.1% | −2.5% | −2.3% | −0.1% | −0.1% | +14.4% | −0.3% | 2W 10L | +3.4% |
| 2013 | −7.3% | −3.4% | −0.1% | +0.6% | −4.4% | +2.8% | +11.1% | +8.7% | −3.0% | +1.8% | +6.7% | −4.4% | 6W 6L | +7.6% |
| 2012 | +0.6% | −1.1% | −1.1% | +2.8% | −1.1% | – | – | −3.2% | −7.3% | +11.2% | −2.1% | +1.7% | 4W 6L | −0.6% |
| 2011 | −3.2% | +15.3% | −0.1% | −1.2% | +0.3% | −0.5% | 0.0% | 0.0% | – | +8.1% | +7.4% | −0.2% | 4W 7L | +27.2% |
| 2010 | – | – | – | – | – | – | – | – | – | – | – | −3.4% | 0W 1L | −3.4% |
Swipe sideways to see every month
Combine your strategies
Save strategies to a portfolio and see how they work together.
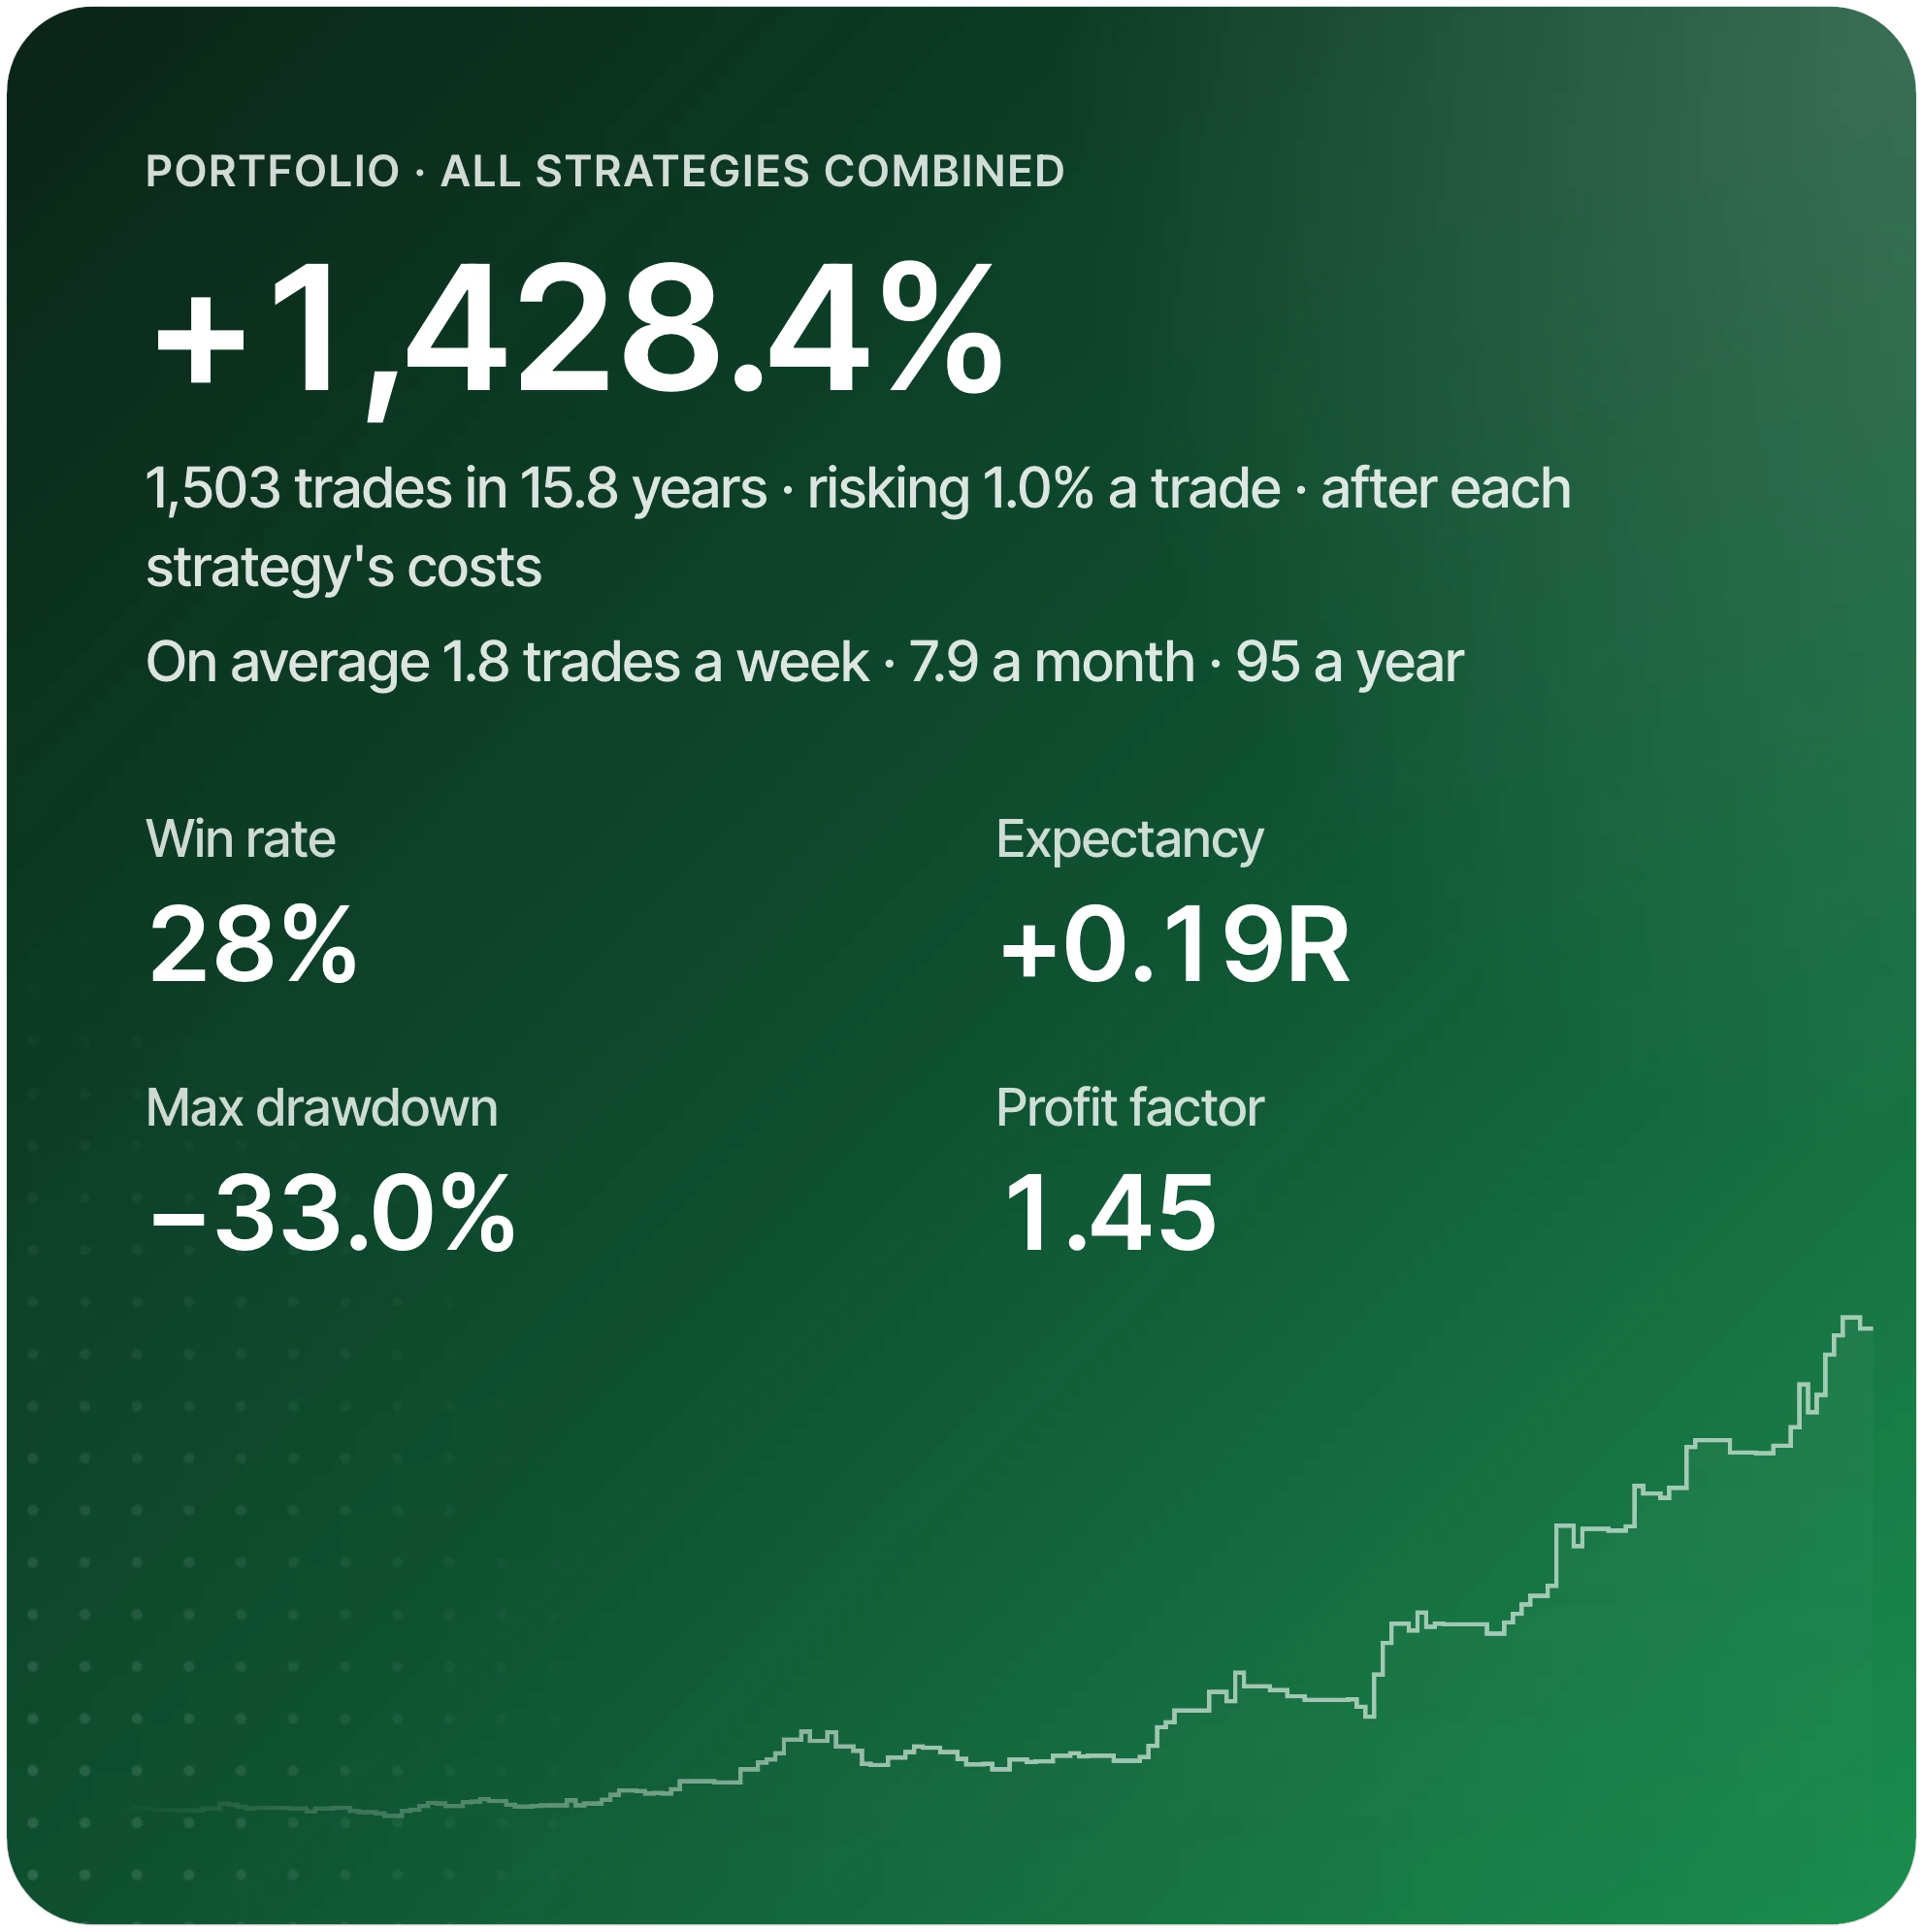
Simulated results on historical data. NQ, 5m entries from 15m IRLs, no higher timeframe context, London Close killzone, stop at the swing's wick, 4R target, no breakeven, standard setups long and short. Compound at 1% risk a trade. Dec 2010 to Oct 2026, costs on ($3 per contract). Past results do not predict future results.
Found a strategy you like?
Add it to the All-in-One indicator.
Add the strategy you backtested in its settings, and it alerts you every time that exact strategy sets up on your live charts.
Find a strategy that held up over years of data.
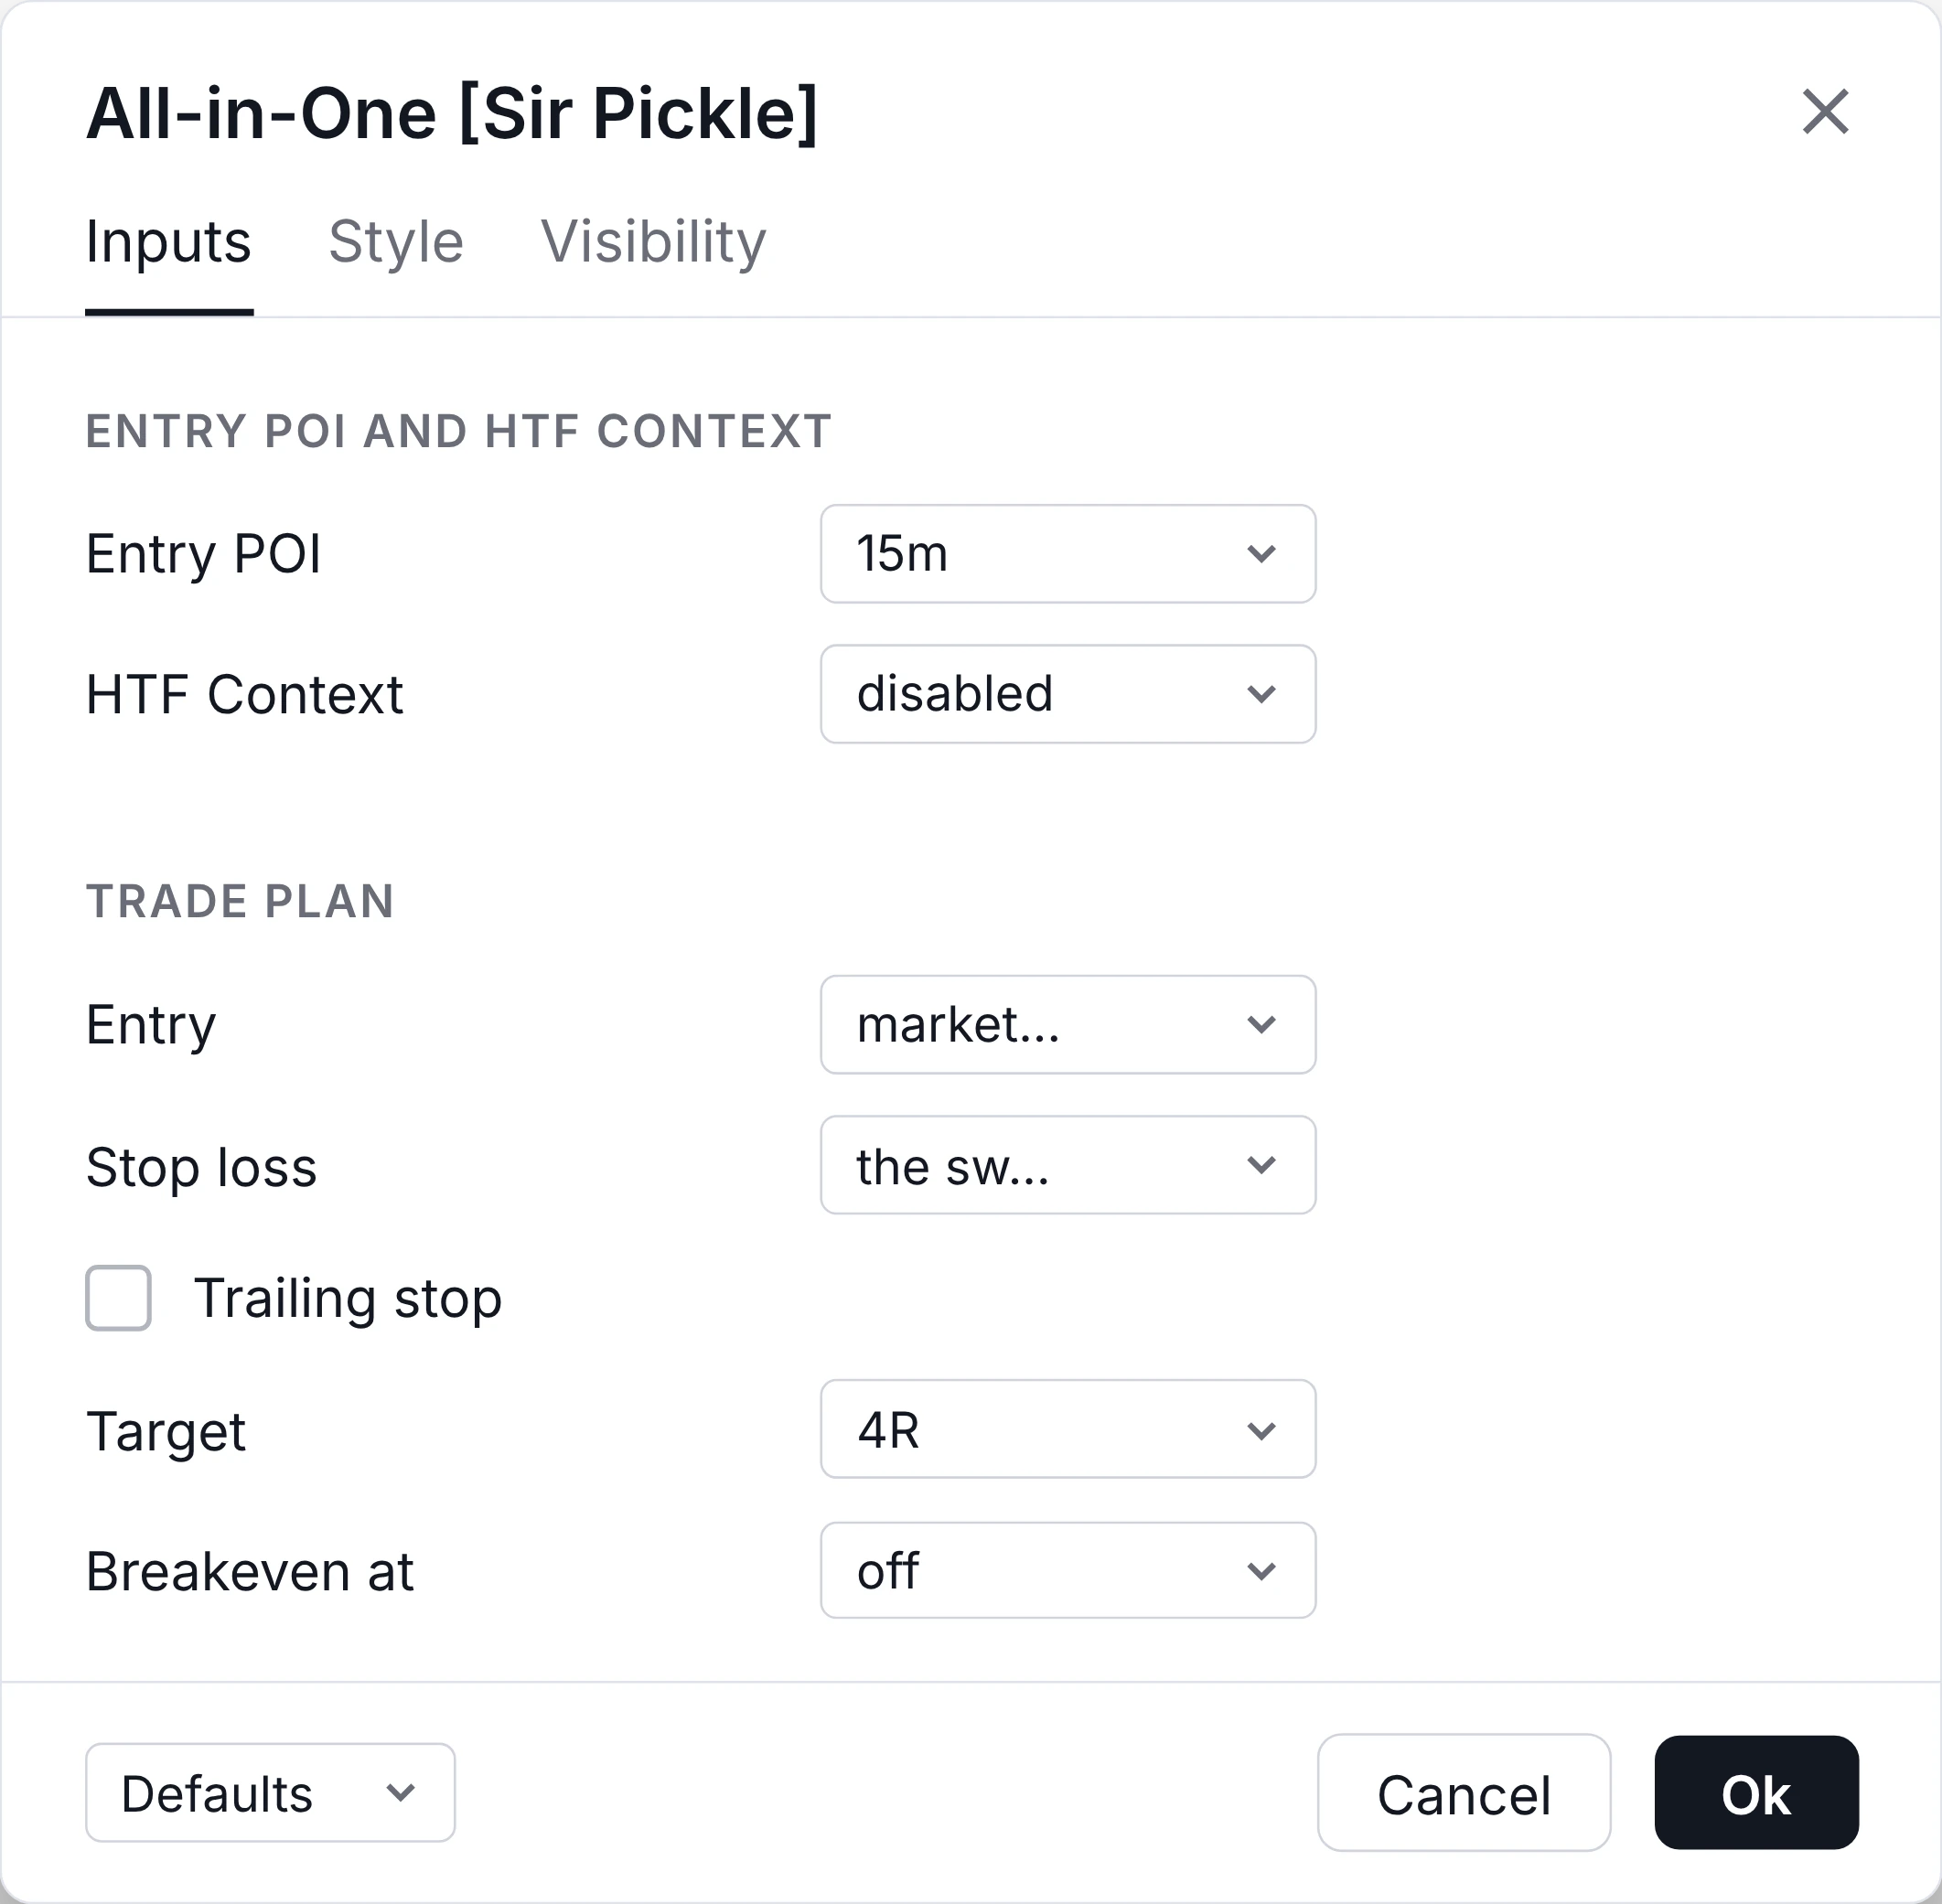
Set the same strategy in its settings on TradingView.
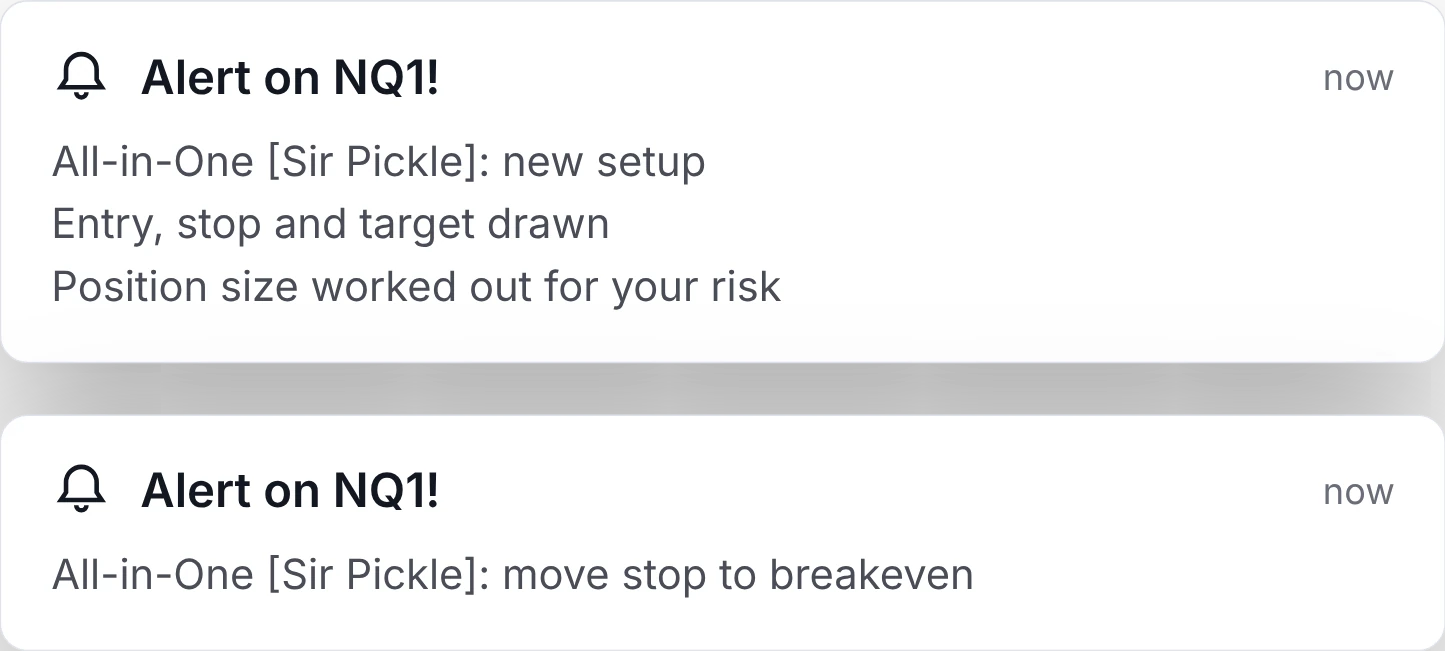
Every time it sets up on your live chart, with the position size worked out.
One-time payment.
All-in-One indicator New
Add the strategy you backtested in its settings. It does the analysis on your live charts and alerts you.
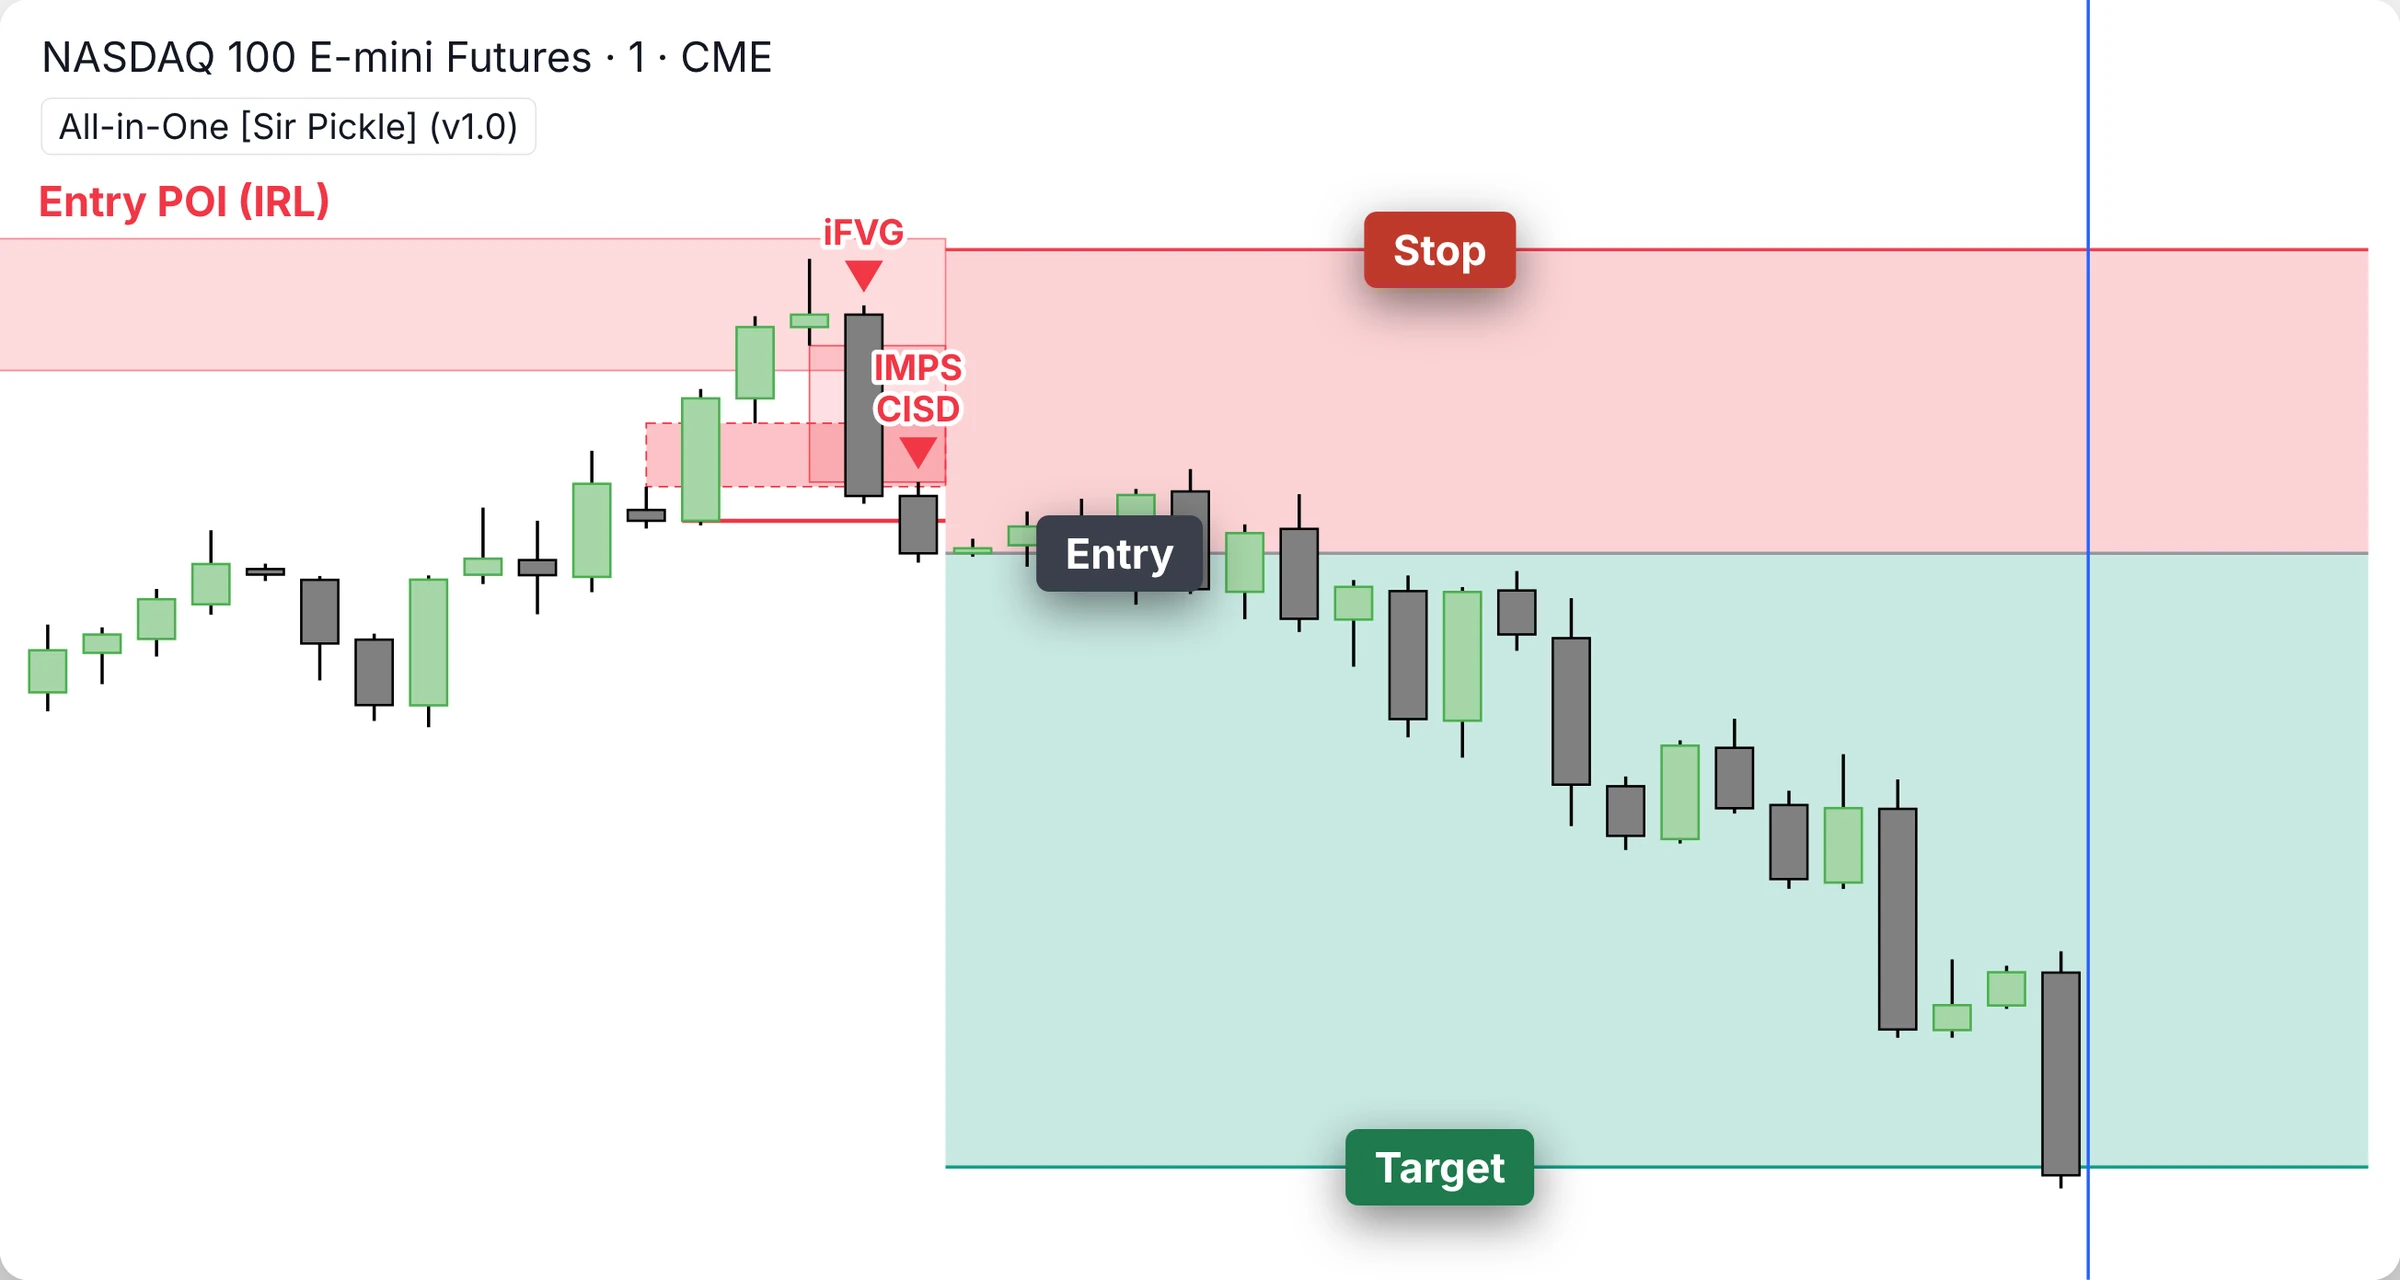
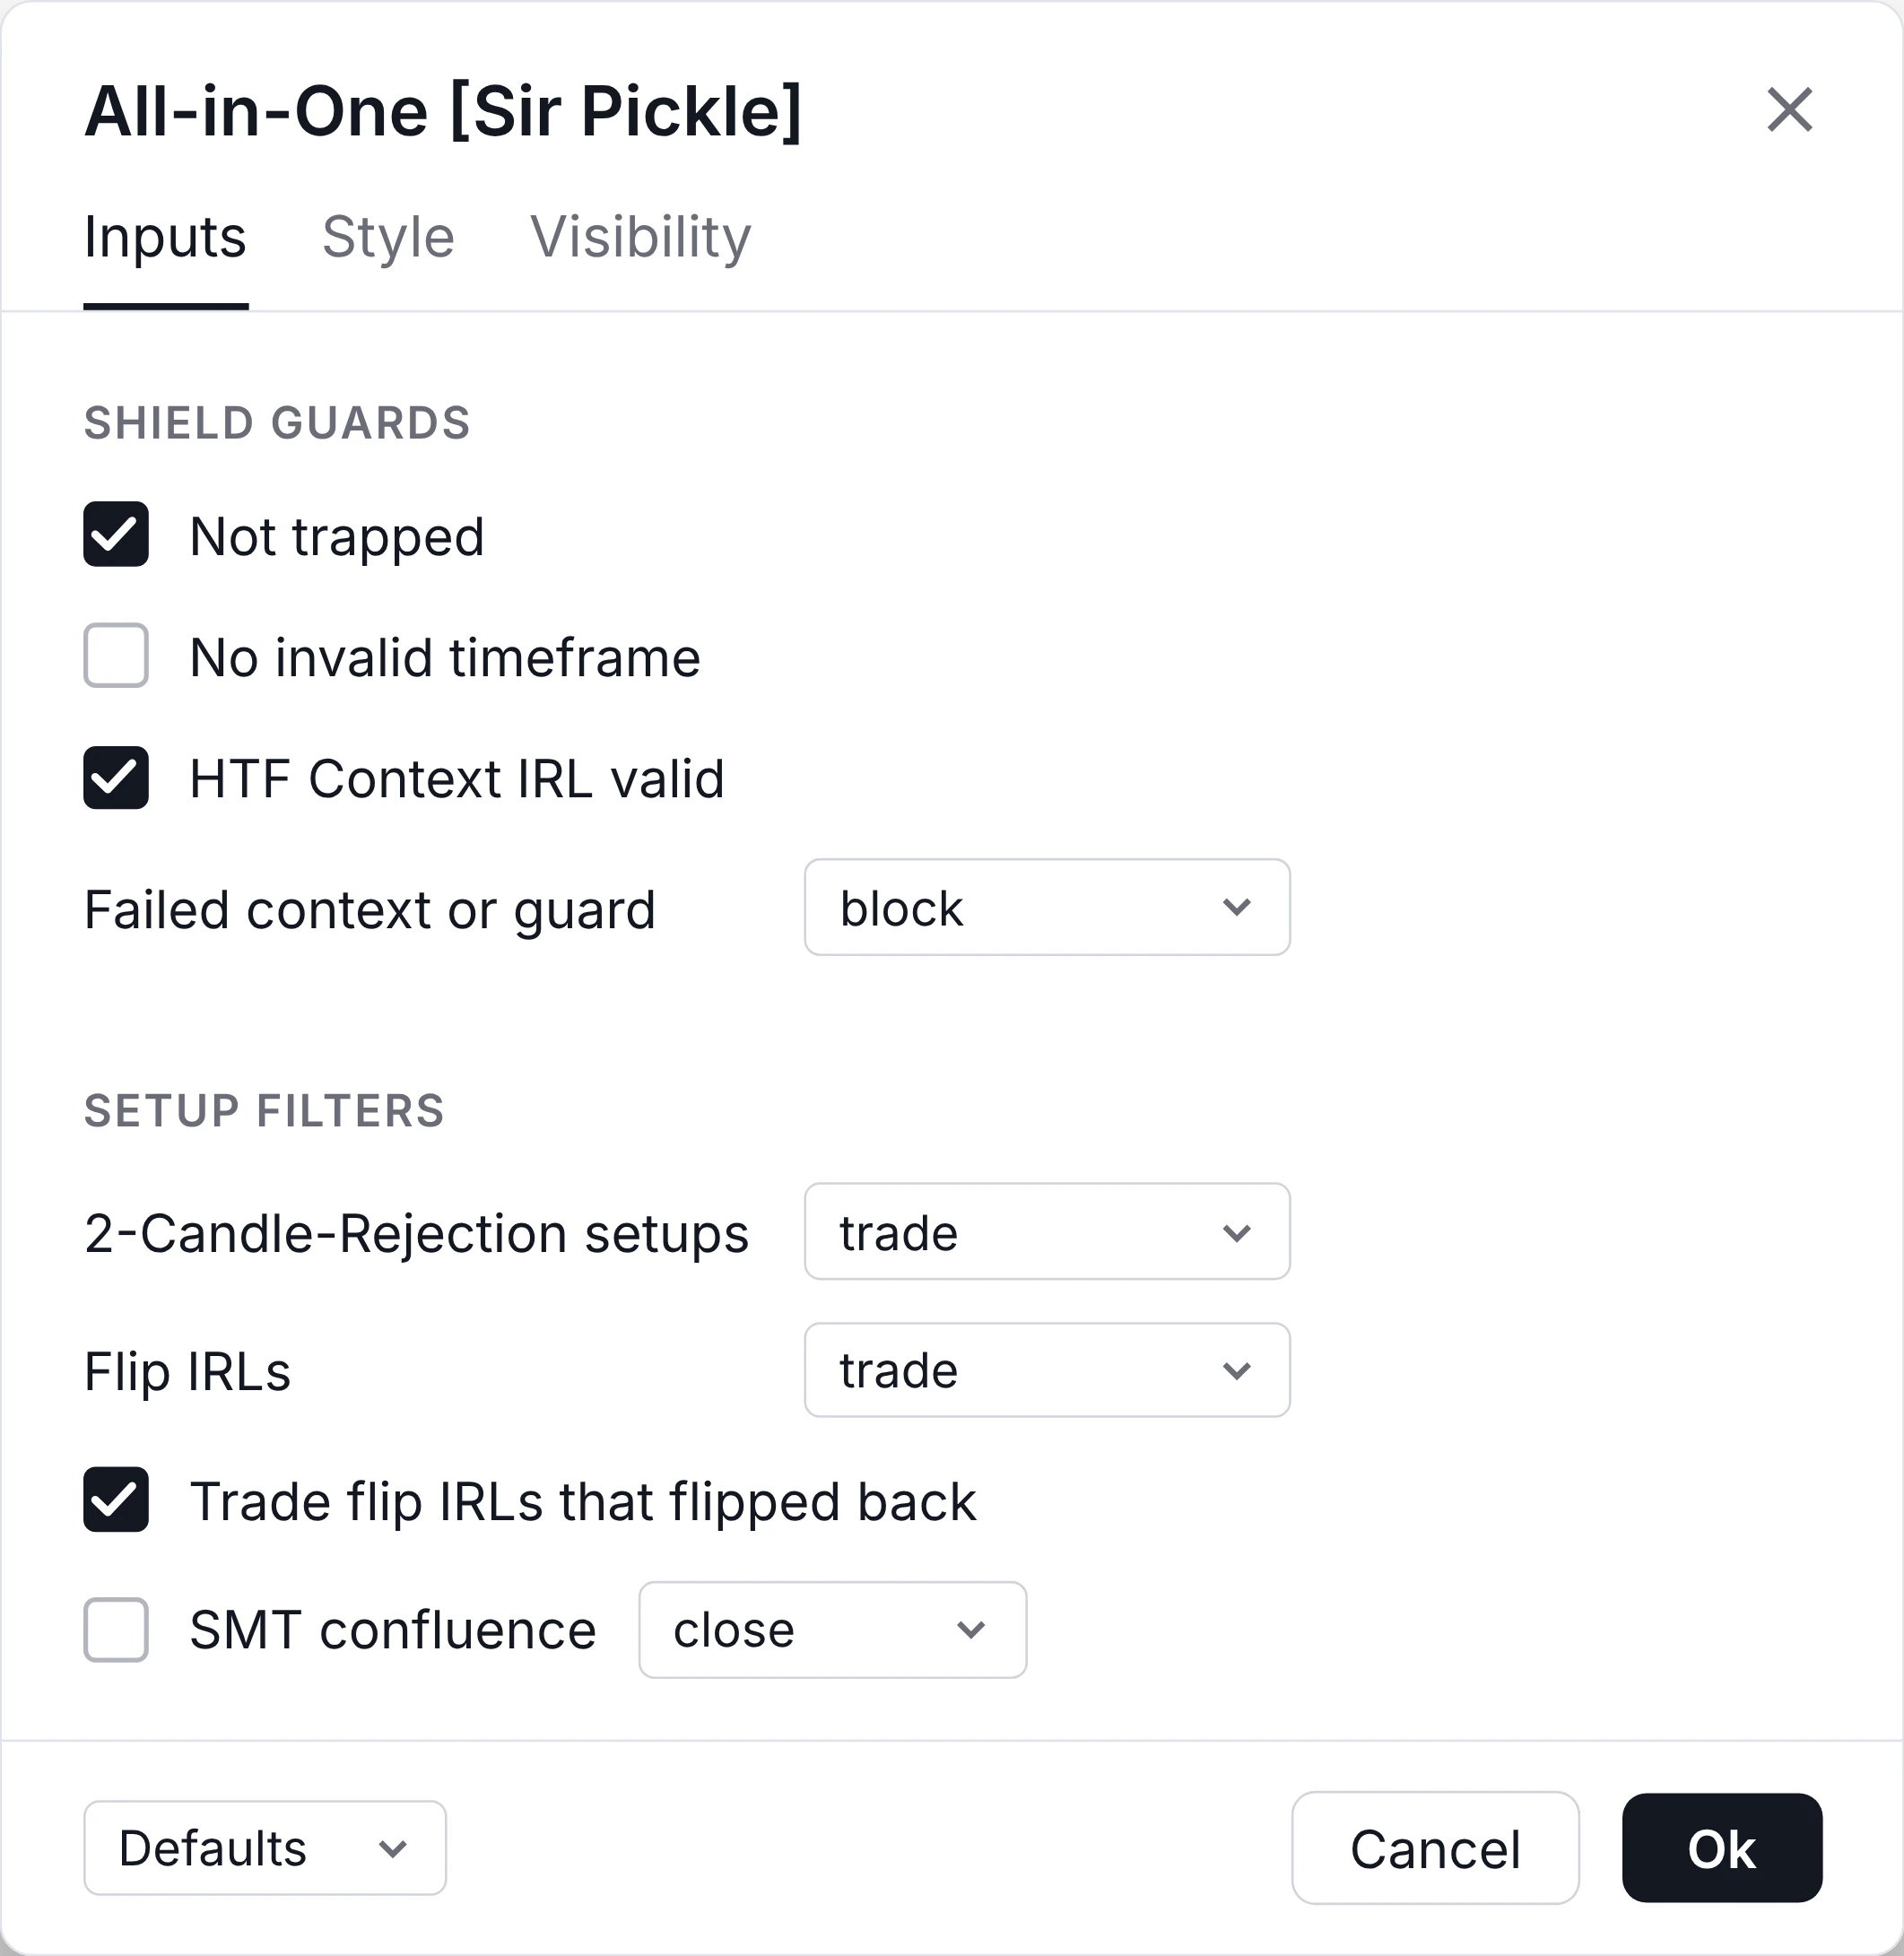
Bias on six timeframes
Sets the Orderflow bias on six timeframes at once and draws the IRLs and ERLs for you.
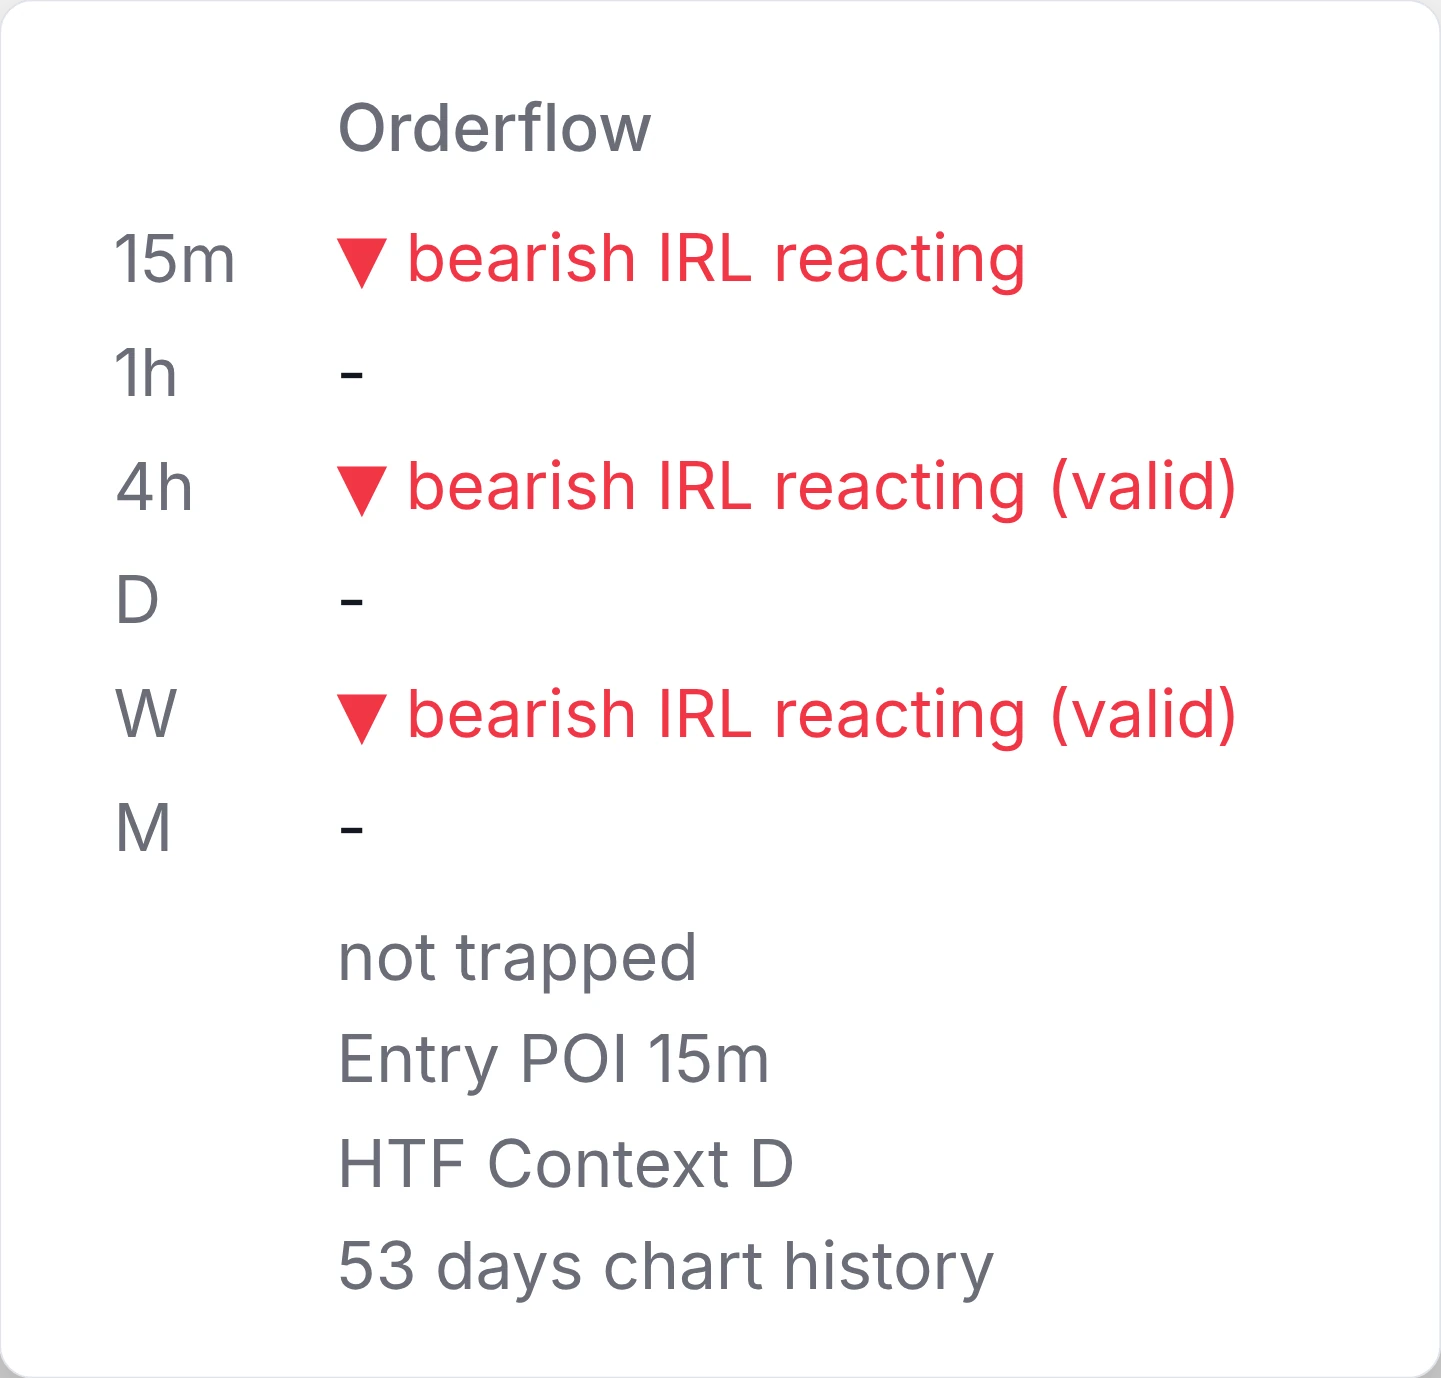
Entry POI and context
Tracks your Entry POI on a higher timeframe and checks the timeframes above agree with the bias.
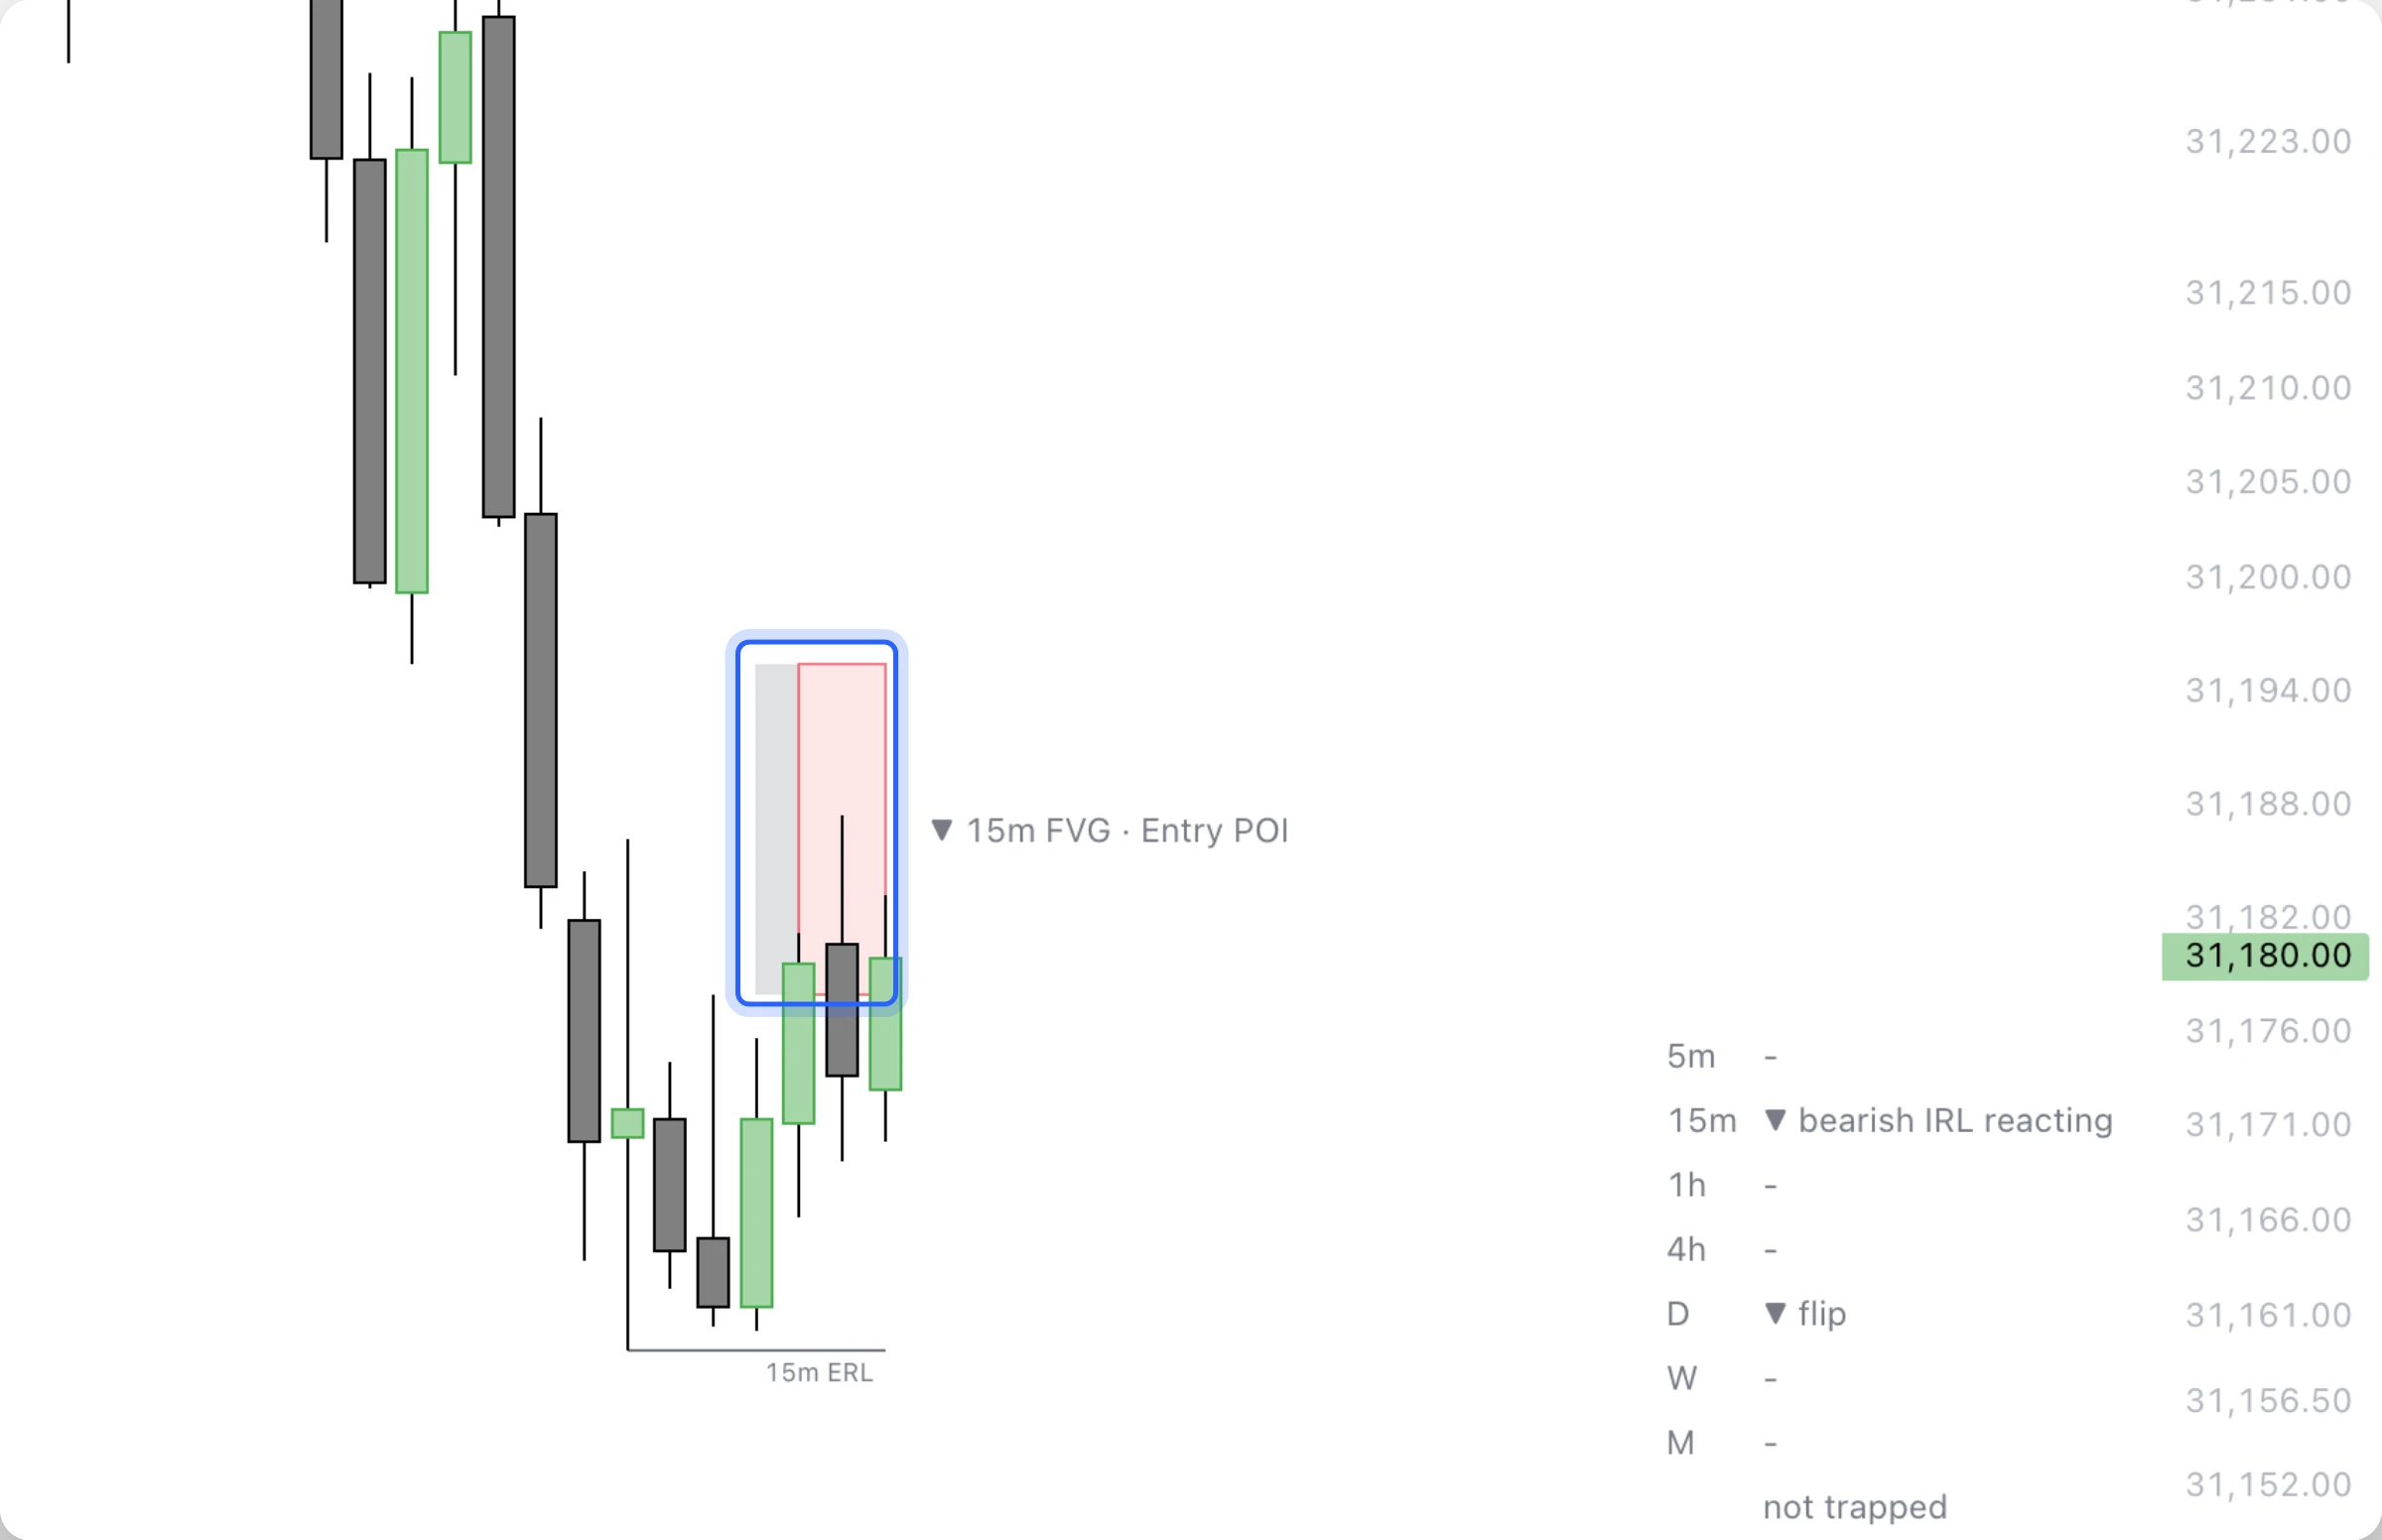
Six entry models
Unicorns, Orderflow Chains, Impulse Shifts, Rapid Impulse Shifts, CISDs and iFVGs. You pick which ones.
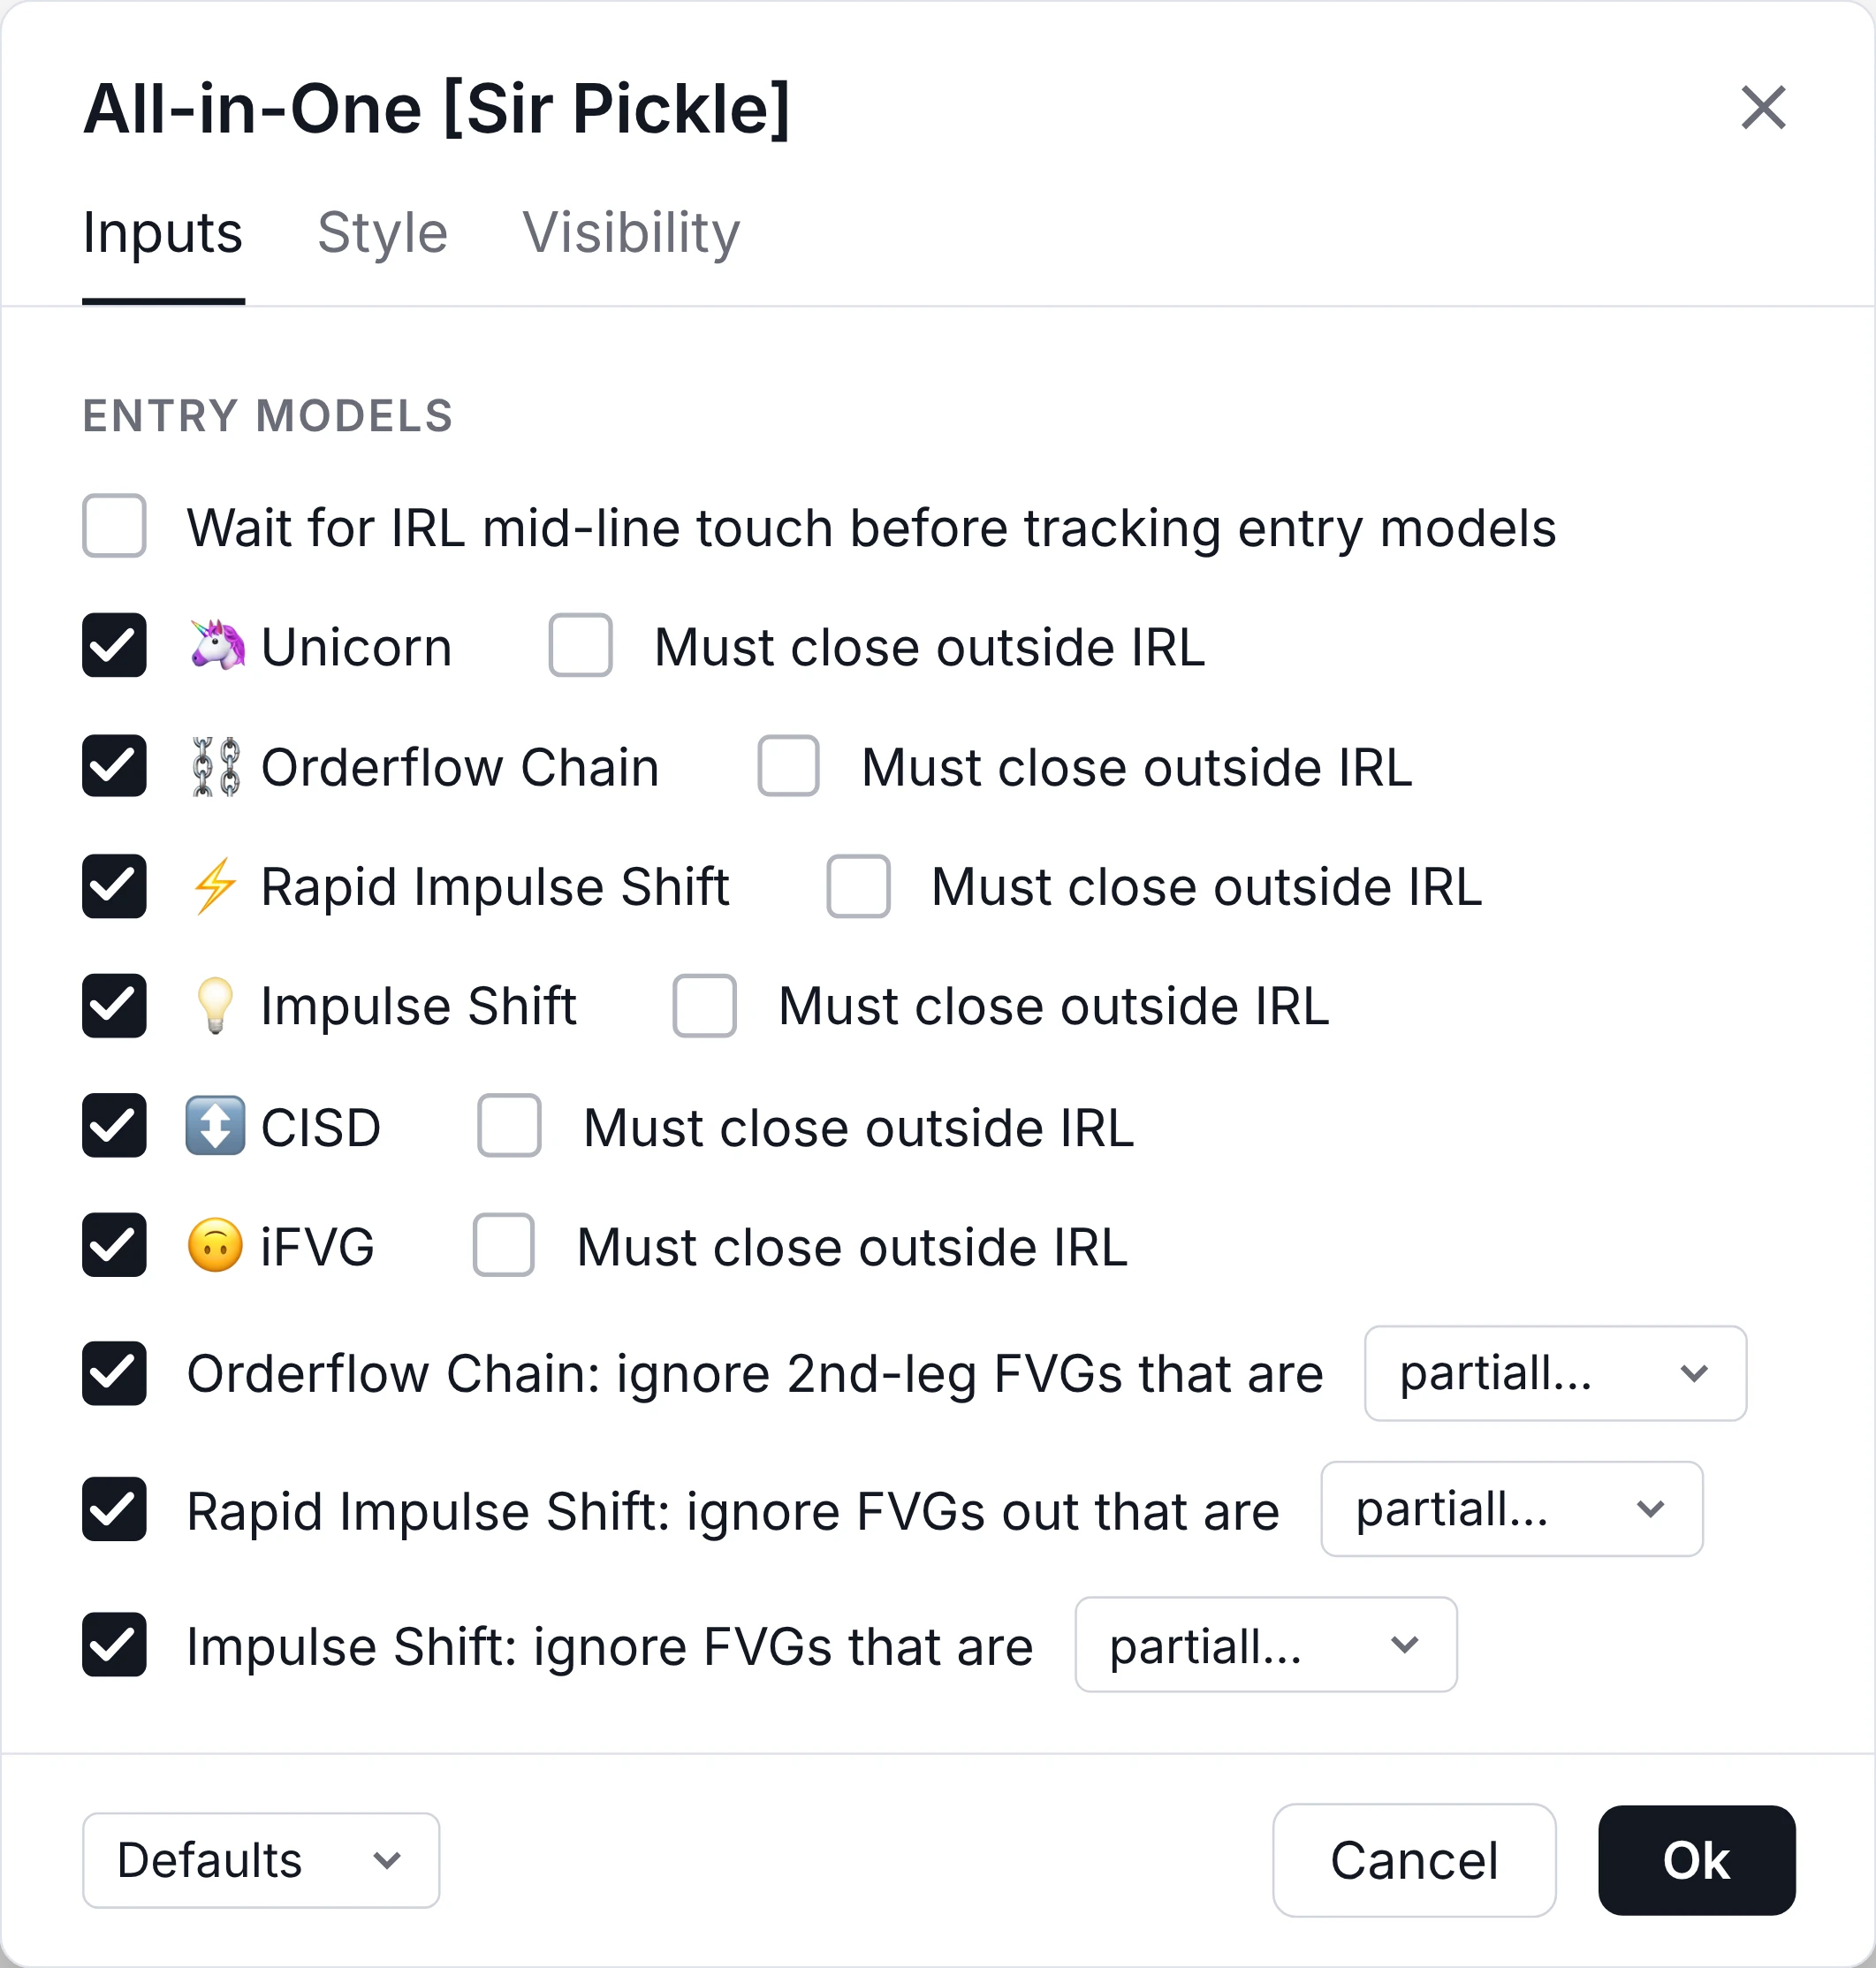
Setups, alerts and filters
Marks the entry, stop and target, alerts you with your position size, and skips setups your strategy would not take.
What traders say about the Sir Pickle indicators.
Swipe to read all 14 reviews