
An instant backtesting tool built for ICT traders.
It takes your exact trading strategy and backtests it instantly, on any timeframe from Daily to 1-minute, with up to 22 years of data.
No card needed. Or see the plans.
You are risking real money on a strategy you have never truly tested.
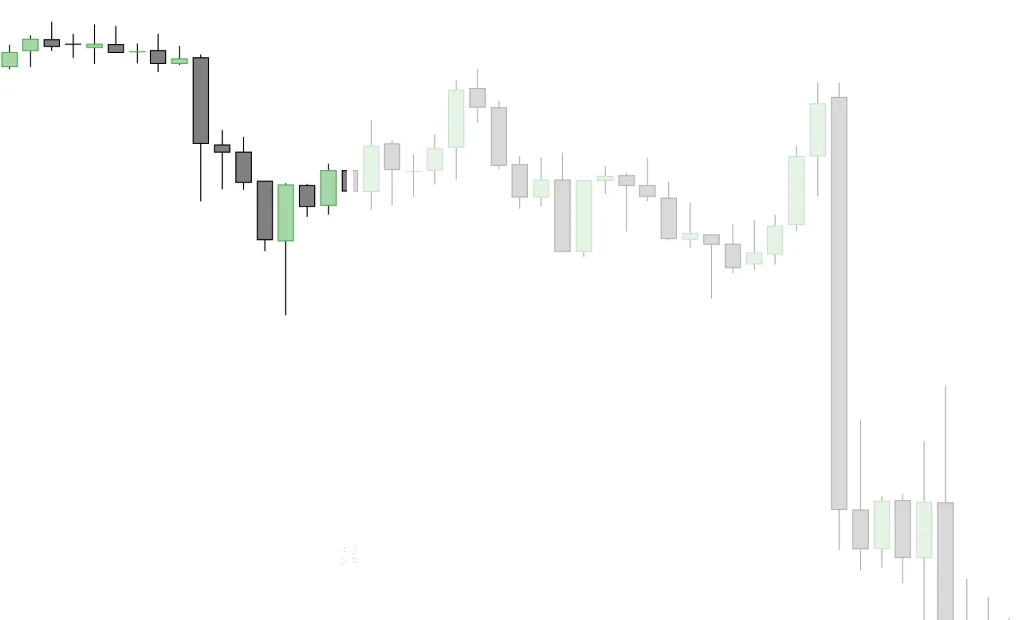
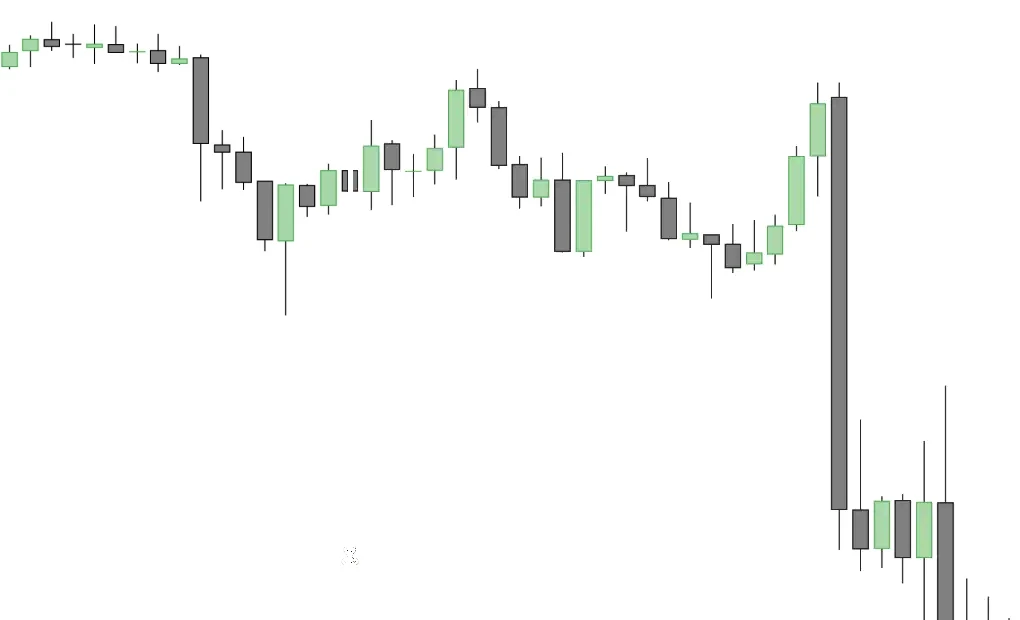
Testing on chart replay for a few weeks is NOT backtesting.
So when the first losing streak hits, which it always will, you start doubting everything.
You start strategy hopping, and you reset the whole process.
No card needed. Or see the plans.
More than a decade of data, backtested in seconds.
Your exact trading strategy, run on up to 16 years of futures data and up to 22 years on forex and CFDs.
Forex and CFD history starts in 2004 on the longest-running markets and later on others.
Choose an asset and answer a few questions about how you trade it.
You choose an asset like NQ. Then you set your entry timeframe, your Entry POI, your higher timeframe context, your killzones, your entry, your stop and your target.


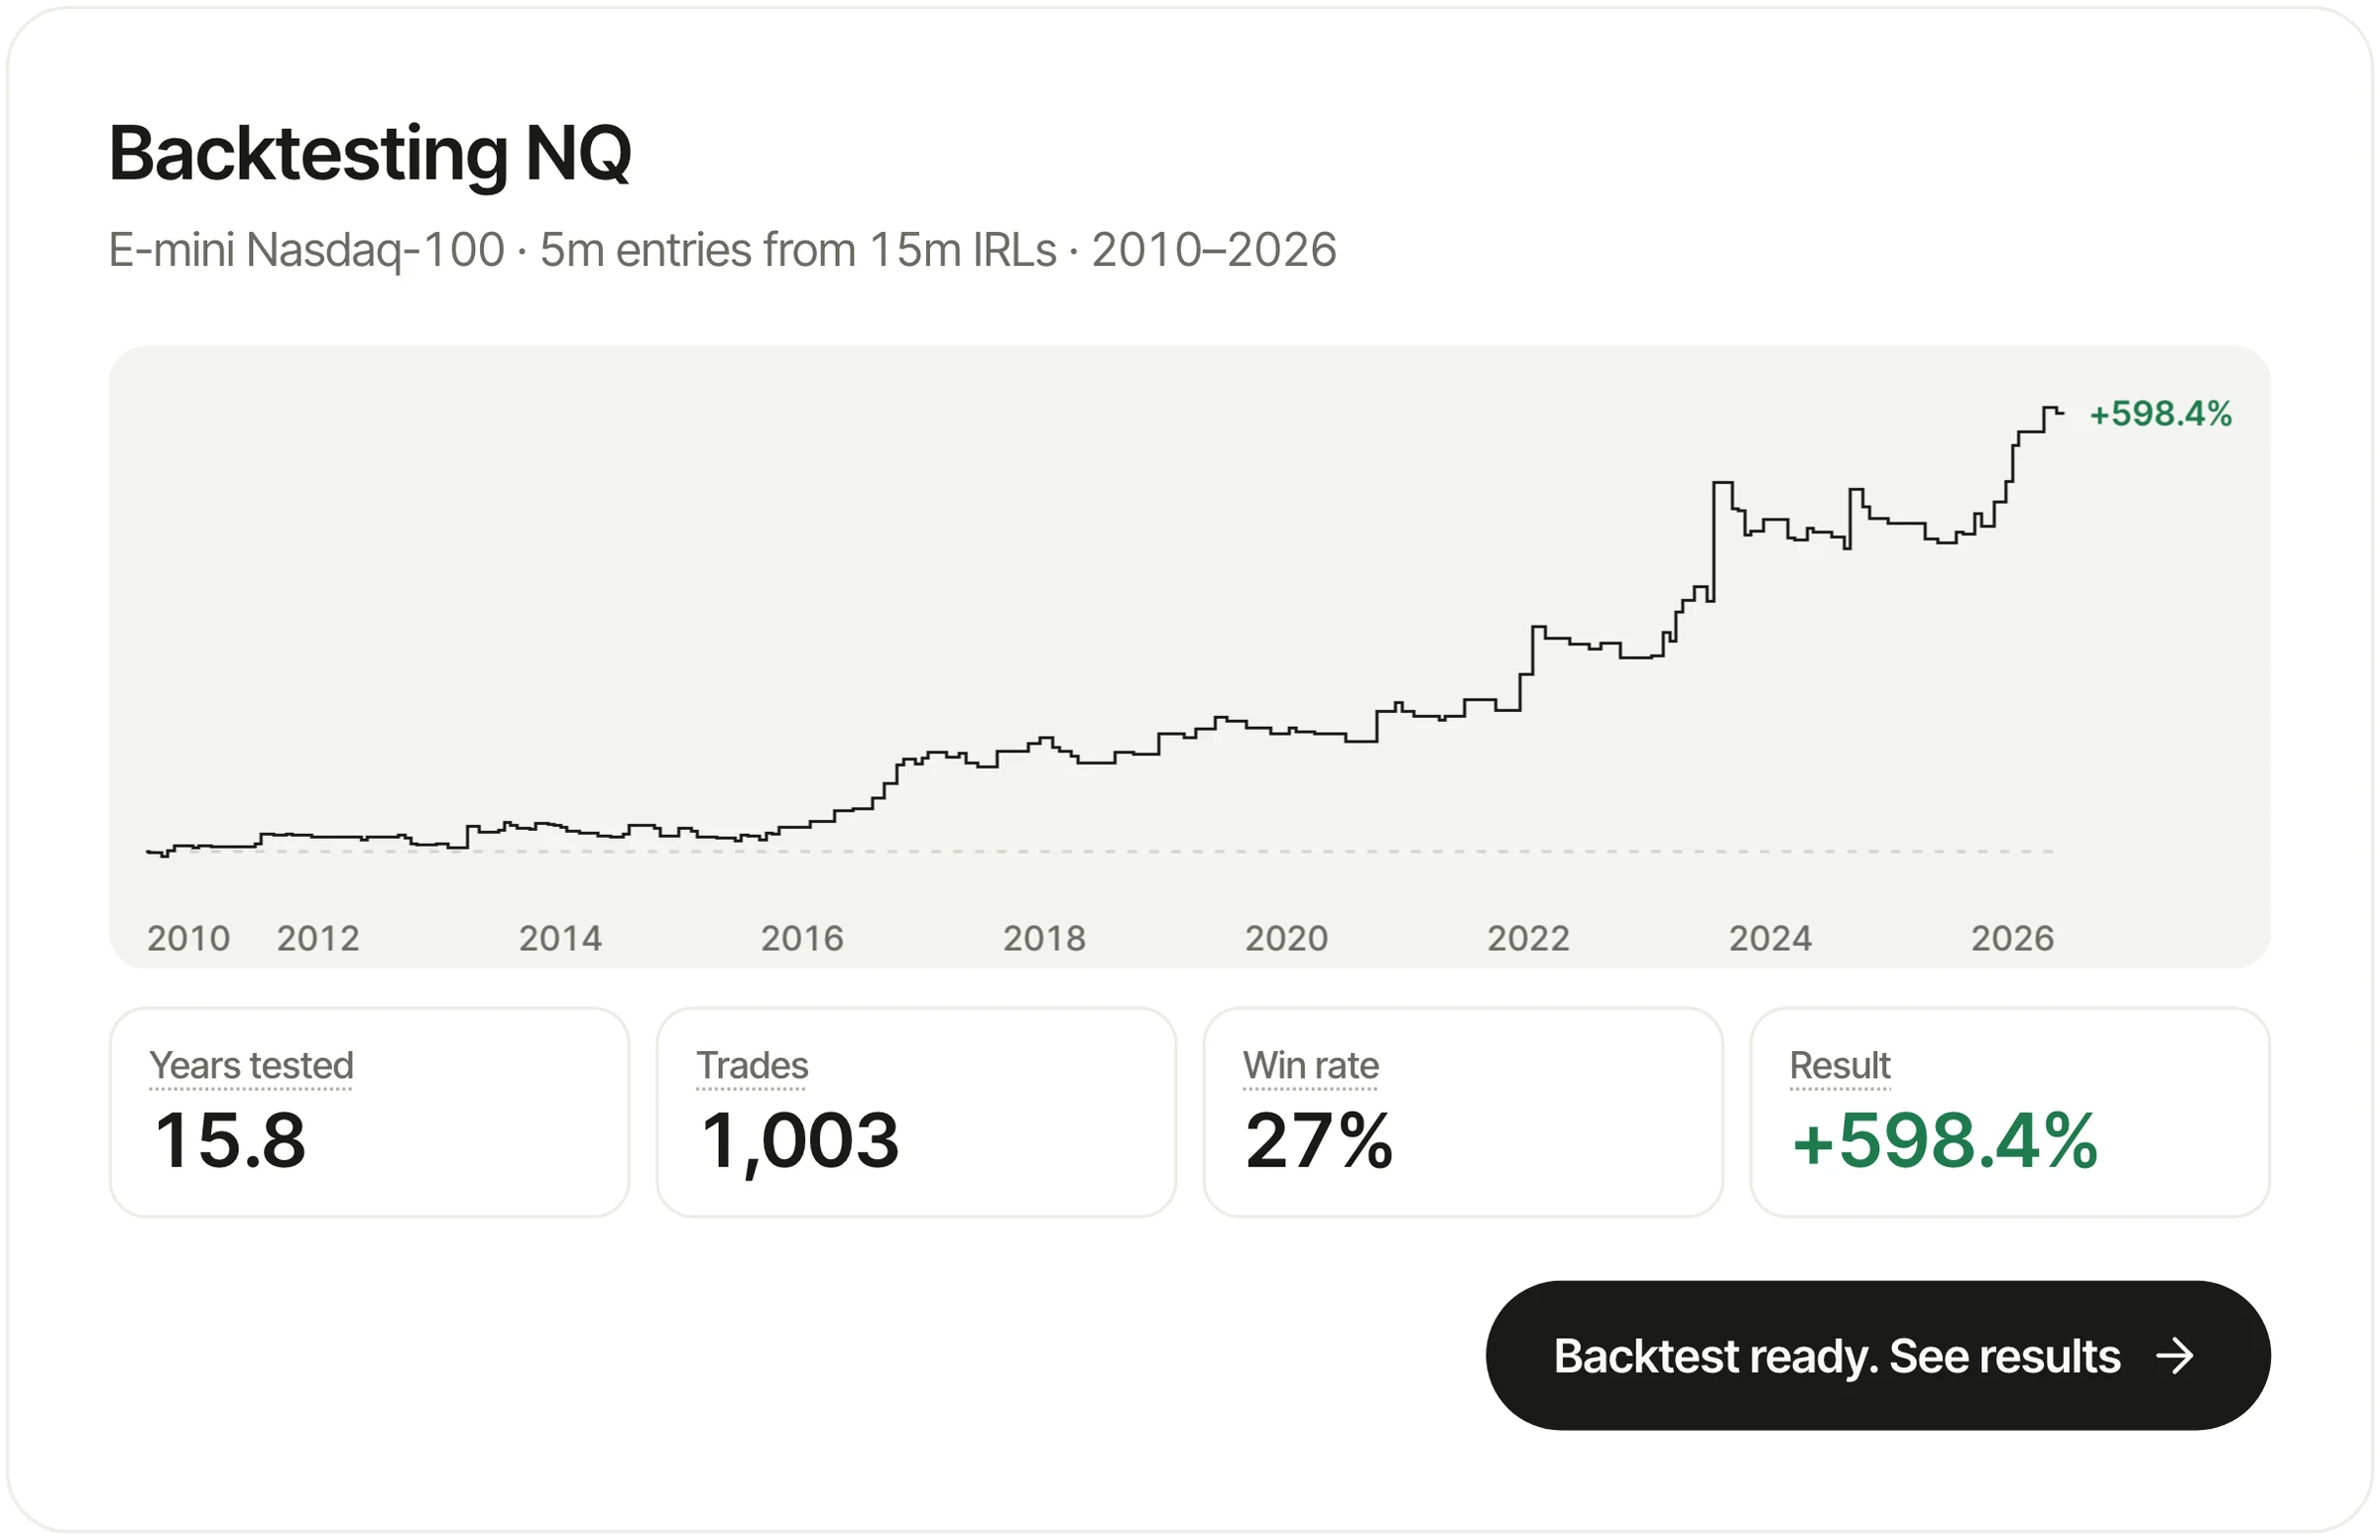
It simulates every trade your strategy would have taken.
The platform goes through the entire history of that asset, finds every setup your strategy would have taken, and simulates every trade.
A few seconds later you are looking at more than a decade of data for your exact trading strategy.

See how your strategy performed, and how many years ended in profit.
You get the equity, the total result, the number of trades, the win rate, the average trade, the max drawdown and how many years ended in profit. So you know how deep the losing streaks went before you ever live through one.

Simulated results on historical data. NQ, 5m entries from 15m IRLs, no higher timeframe context, London Close killzone, stop at the swing's wick, 4R target, no breakeven, standard setups long and short. Compound at 1% risk a trade. Dec 2010 to Oct 2026, costs on ($3 per contract). Past results do not predict future results.
No card needed. Or see the plans.
See which part of your strategy carried the results.
It splits the results by long and short, by entry model, by trading hours and weekdays. So you see which parts of your strategy actually cost you money.
Did your longs or your shorts make more?
Each side of the strategy on its own.

Which entry model made the most?
Every entry model's own trades and result.

Which years and months made the money?
Every month since 2010, and how many months each year ended up or down.
| Jan | Feb | Mar | Apr | May | Jun | Jul | Aug | Sep | Oct | Nov | Dec | W/L months | Year | |
|---|---|---|---|---|---|---|---|---|---|---|---|---|---|---|
| 2026 | −3.0% | +3.9% | +3.9% | +9.1% | +4.0% | +3.9% | – | +0.9% | −2.0% | – | – | – | 6W 2L | +22.0% |
| 2025 | +11.2% | −2.0% | −2.0% | 0.0% | −1.0% | −1.0% | −1.0% | −1.0% | −1.0% | +2.9% | 0.0% | +6.8% | 3W 9L | +11.5% |
| 2024 | −1.4% | −6.0% | +0.9% | +3.0% | −3.4% | −1.1% | +3.4% | −2.0% | 0.0% | −1.2% | −1.0% | −2.0% | 3W 9L | −10.6% |
| 2023 | −2.0% | −2.0% | – | +3.8% | +6.4% | −3.0% | +9.1% | +8.1% | −0.9% | −3.3% | +36.7% | −4.9% | 5W 6L | +51.1% |
| 2022 | −3.9% | – | – | +31.5% | +6.0% | −3.0% | −1.1% | −1.0% | −3.1% | +0.9% | −0.4% | +0.8% | 4W 6L | +24.9% |
| 2021 | +3.9% | +17.0% | −1.0% | −3.0% | −2.1% | −2.0% | 0.0% | +10.1% | 0.0% | 0.0% | −1.0% | – | 3W 8L | +22.0% |
| 2020 | −2.0% | −2.1% | 0.0% | +2.9% | −2.0% | −0.1% | 0.0% | −1.0% | – | – | −4.0% | −0.1% | 1W 9L | −8.2% |
| 2019 | 0.0% | −2.1% | −3.0% | +16.8% | −1.0% | 0.0% | +6.0% | −2.1% | +1.9% | +1.7% | −1.0% | −1.1% | 4W 8L | +15.6% |
| 2018 | −3.1% | – | +6.0% | +2.0% | −5.1% | −2.1% | 0.0% | −6.1% | −1.1% | −1.0% | −3.0% | +12.4% | 3W 8L | −2.6% |
| 2017 | +21.4% | +0.5% | +2.7% | +1.7% | +3.5% | −1.0% | −3.0% | +2.9% | −7.1% | +8.0% | – | +3.5% | 8W 3L | +35.4% |
| 2016 | +2.9% | −0.1% | +8.1% | −1.0% | +2.9% | +3.9% | −2.0% | +12.3% | +4.0% | −3.0% | −2.2% | +16.4% | 7W 5L | +48.5% |
| 2015 | −2.1% | −8.5% | −2.2% | −1.4% | +7.2% | −6.1% | −0.1% | 0.0% | 0.0% | +1.4% | +0.8% | −0.3% | 3W 9L | −11.6% |
| 2014 | −1.1% | +6.8% | −2.2% | −0.4% | −3.4% | −4.1% | −2.5% | −2.3% | −0.1% | −0.1% | +14.4% | −0.3% | 2W 10L | +3.4% |
| 2013 | −7.3% | −3.4% | −0.1% | +0.6% | −4.4% | +2.8% | +11.1% | +8.7% | −3.0% | +1.8% | +6.7% | −4.4% | 6W 6L | +7.6% |
| 2012 | +0.6% | −1.1% | −1.1% | +2.8% | −1.1% | – | – | −3.2% | −7.3% | +11.2% | −2.1% | +1.7% | 4W 6L | −0.6% |
| 2011 | −3.2% | +15.3% | −0.1% | −1.2% | +0.3% | −0.5% | 0.0% | 0.0% | – | +8.1% | +7.4% | −0.2% | 4W 7L | +27.2% |
| 2010 | – | – | – | – | – | – | – | – | – | – | – | −3.4% | 0W 1L | −3.4% |
Swipe sideways to see every month
Which hours and days are worth trading?
Keep only the setups from the hours and days you choose.

Does it still hold up lately?
Narrow it to the last 10, 5 or 3 years.

Simulated results on historical data, same NQ strategy as above.
Change one thing and run it again.
Try a different stop, a different target, or a different killzone. Every adjustment takes just a few seconds.

Switch on the rules you trade with.
Make it wait for the release on CPI, NFP and FOMC days, or ask for SMT as a necessary extra confluence.

See how multiple trading strategies work together.
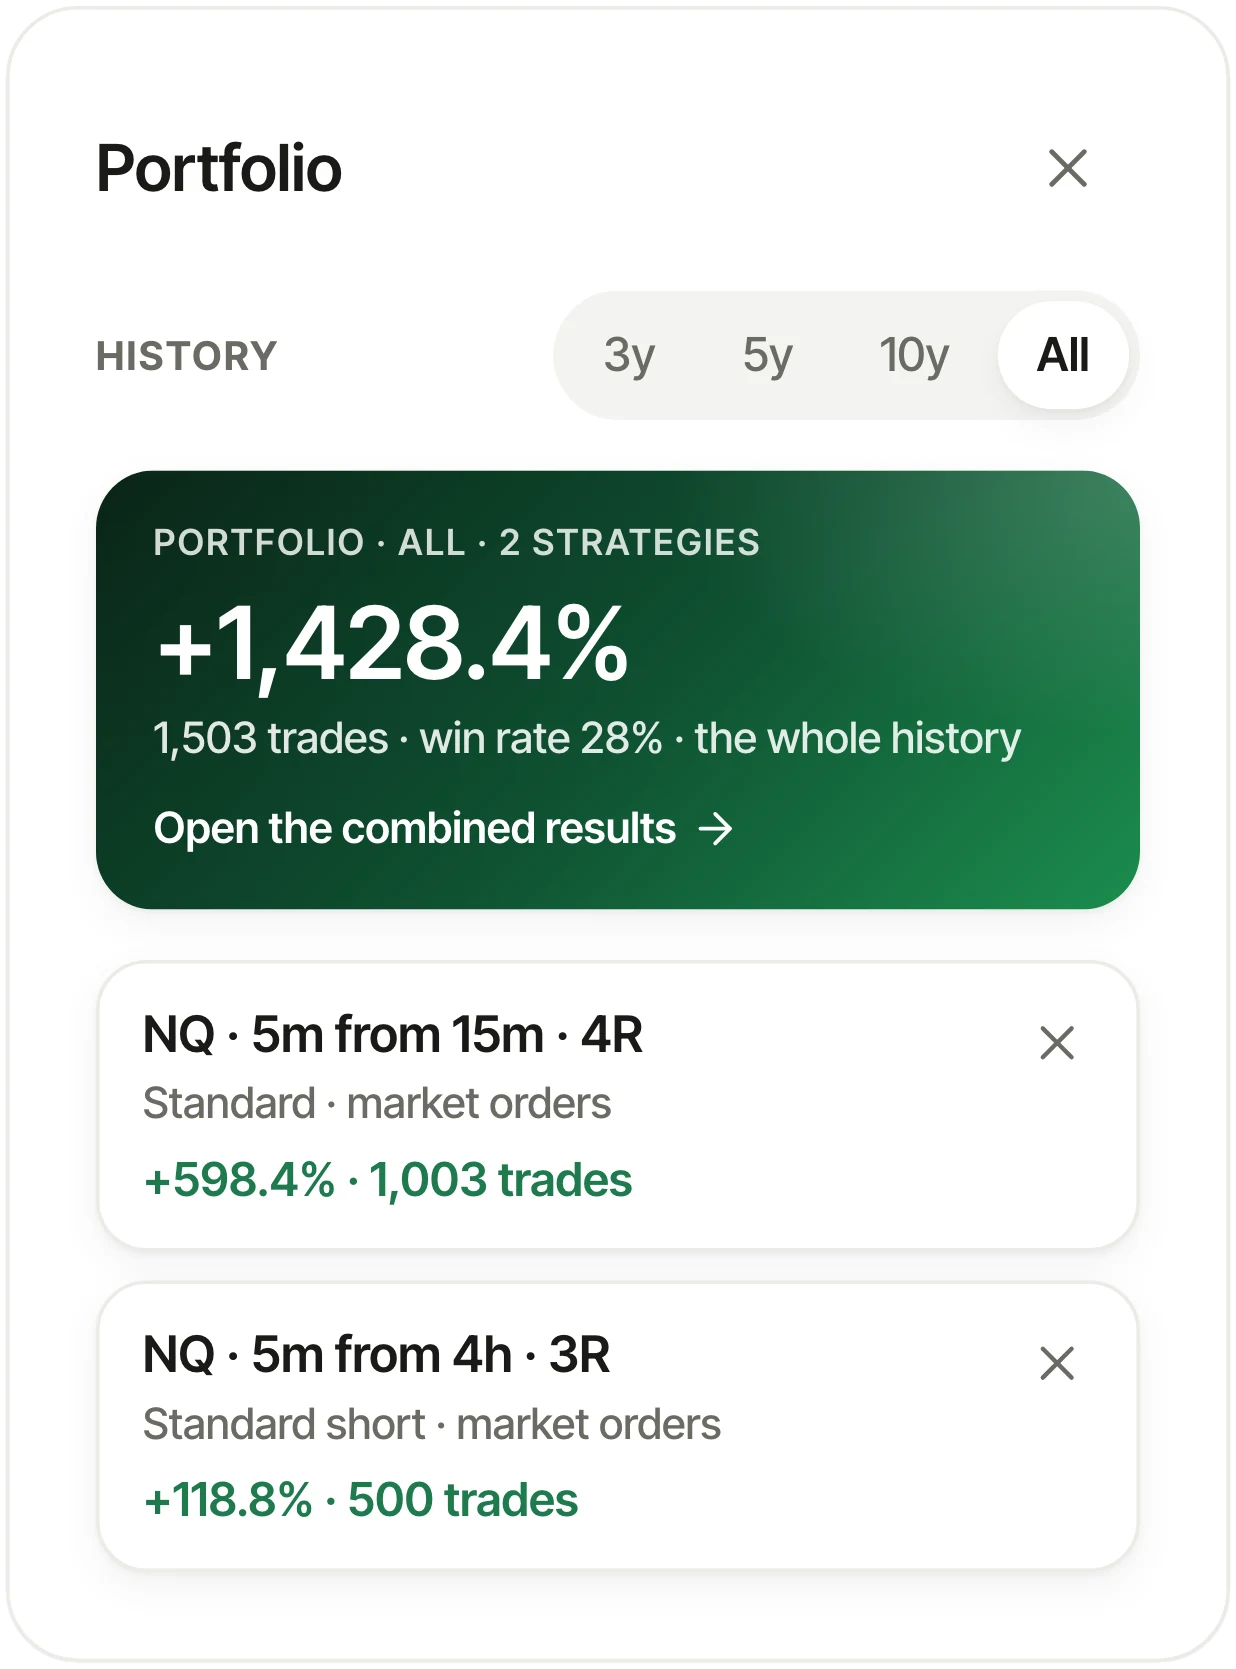
When you have strategies you like, save them to your portfolio. The platform puts them together and shows you the combined equity curve and combined drawdown.
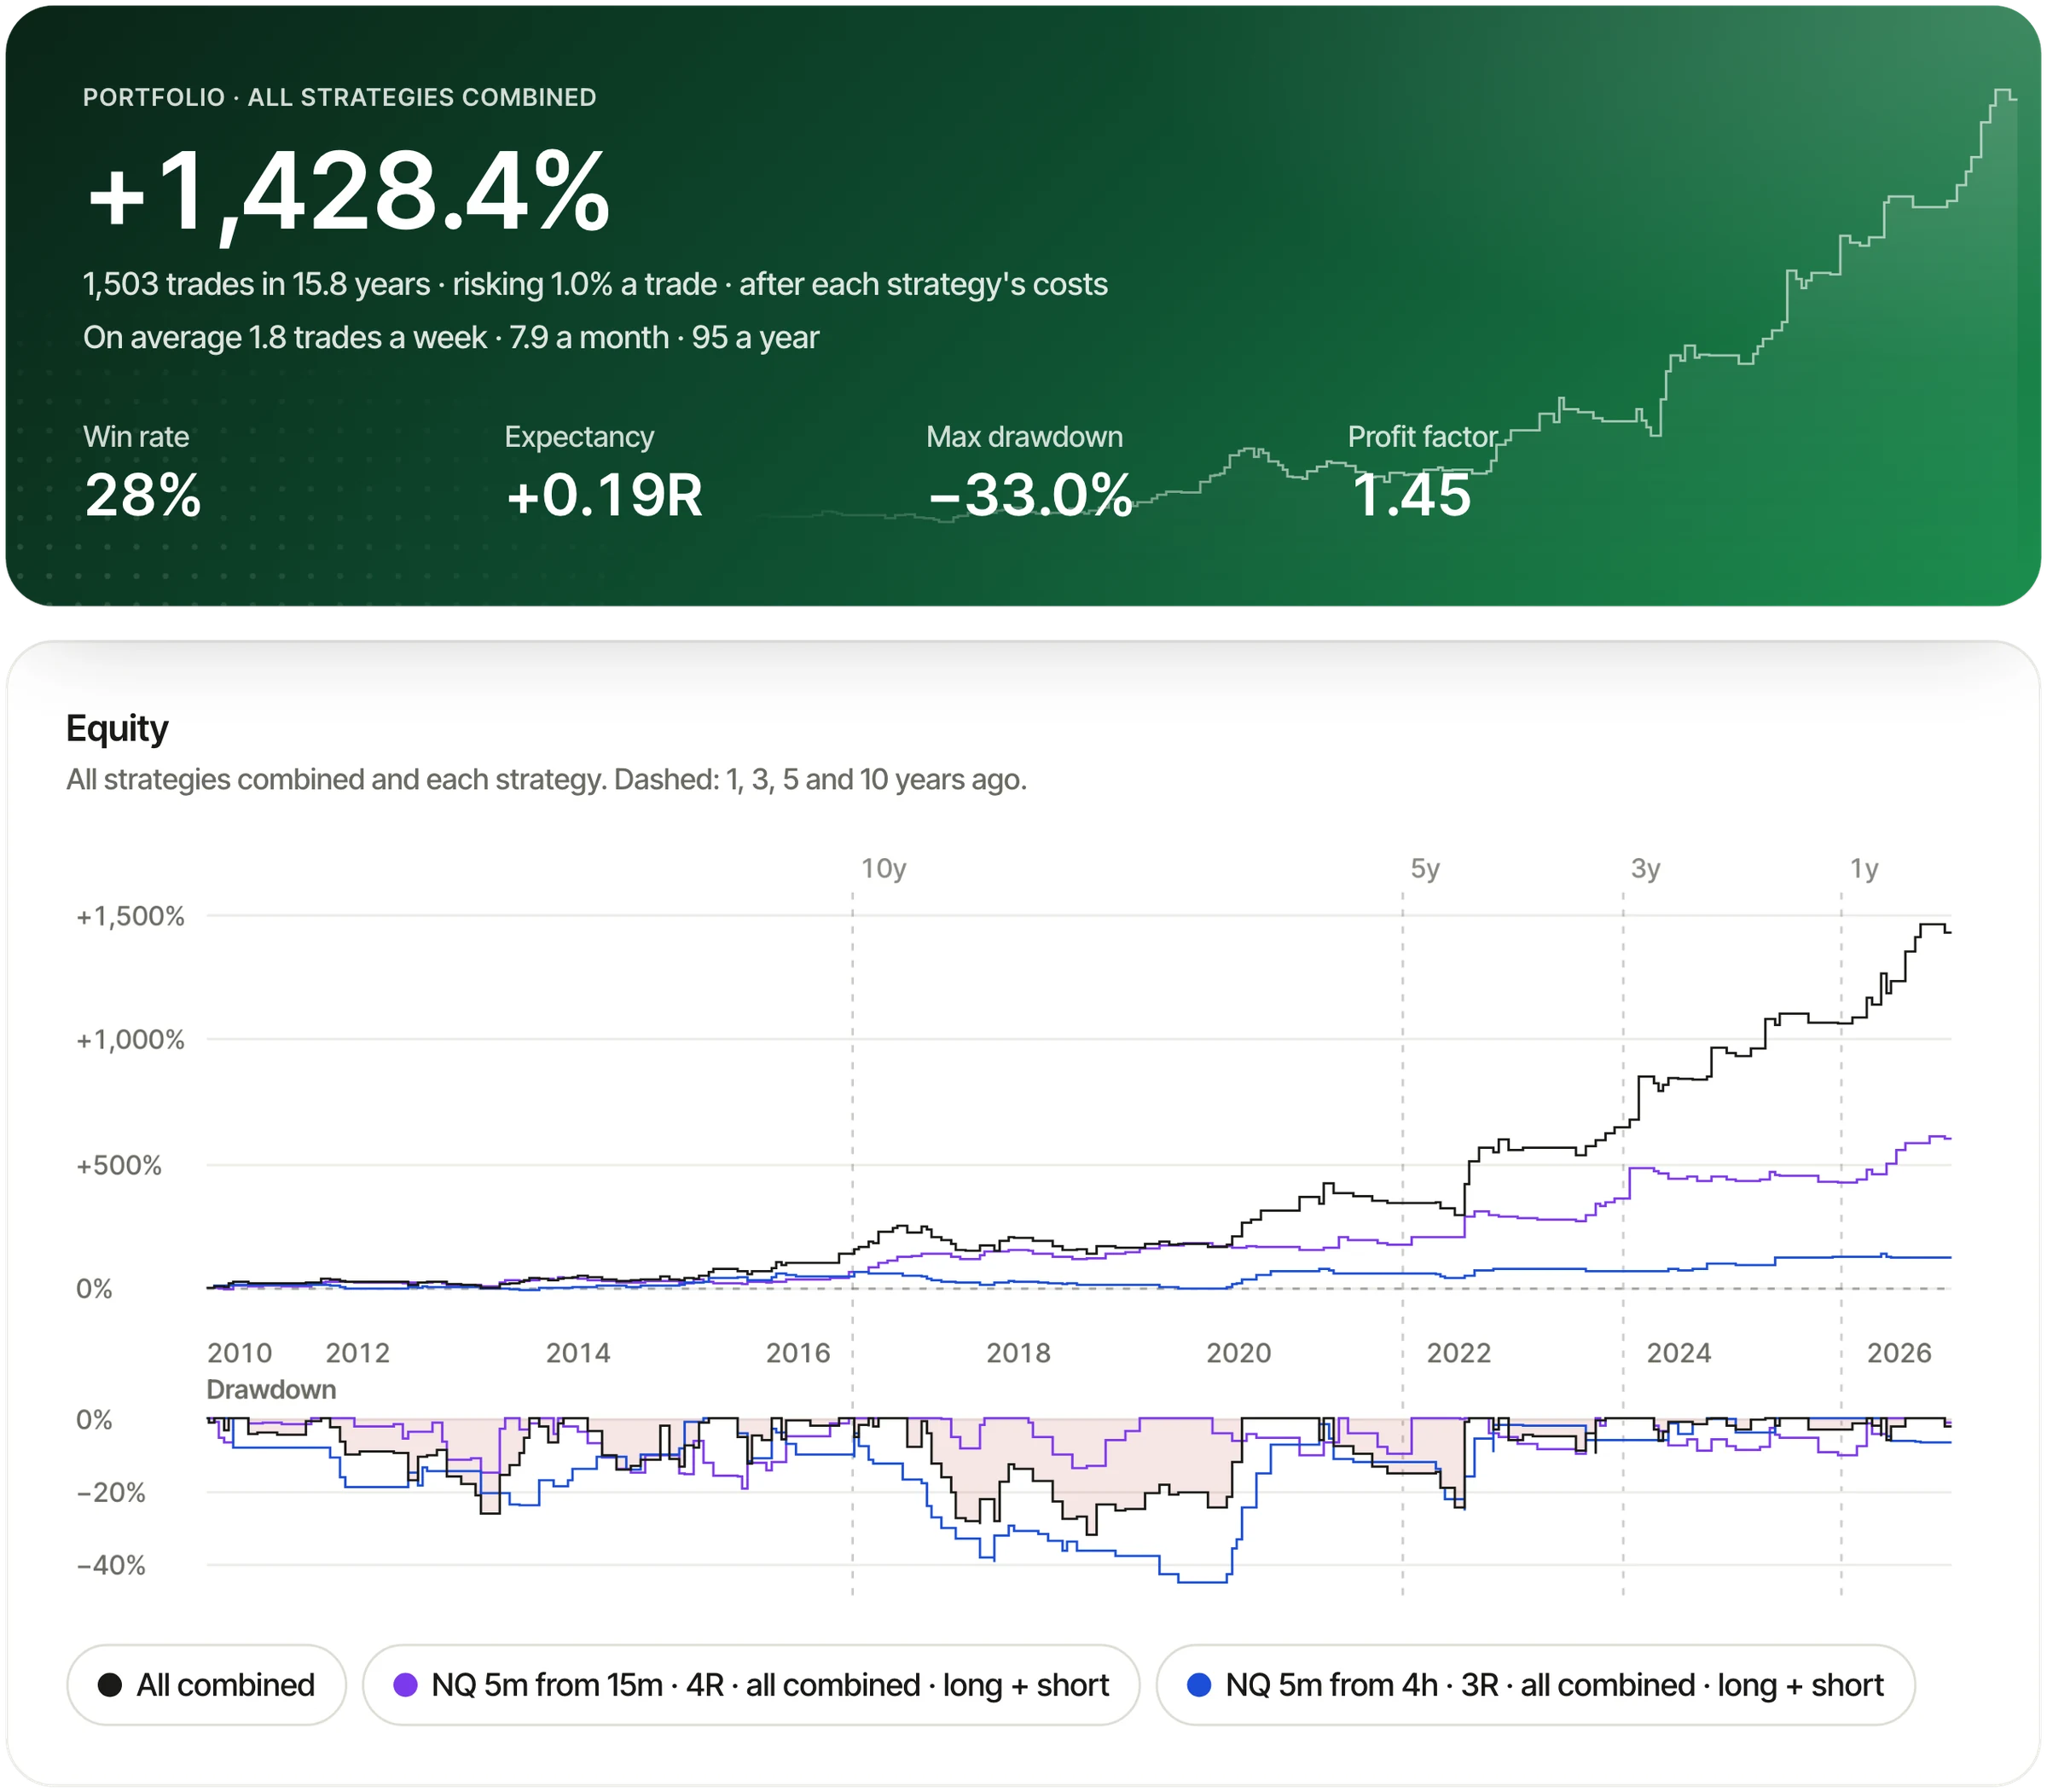
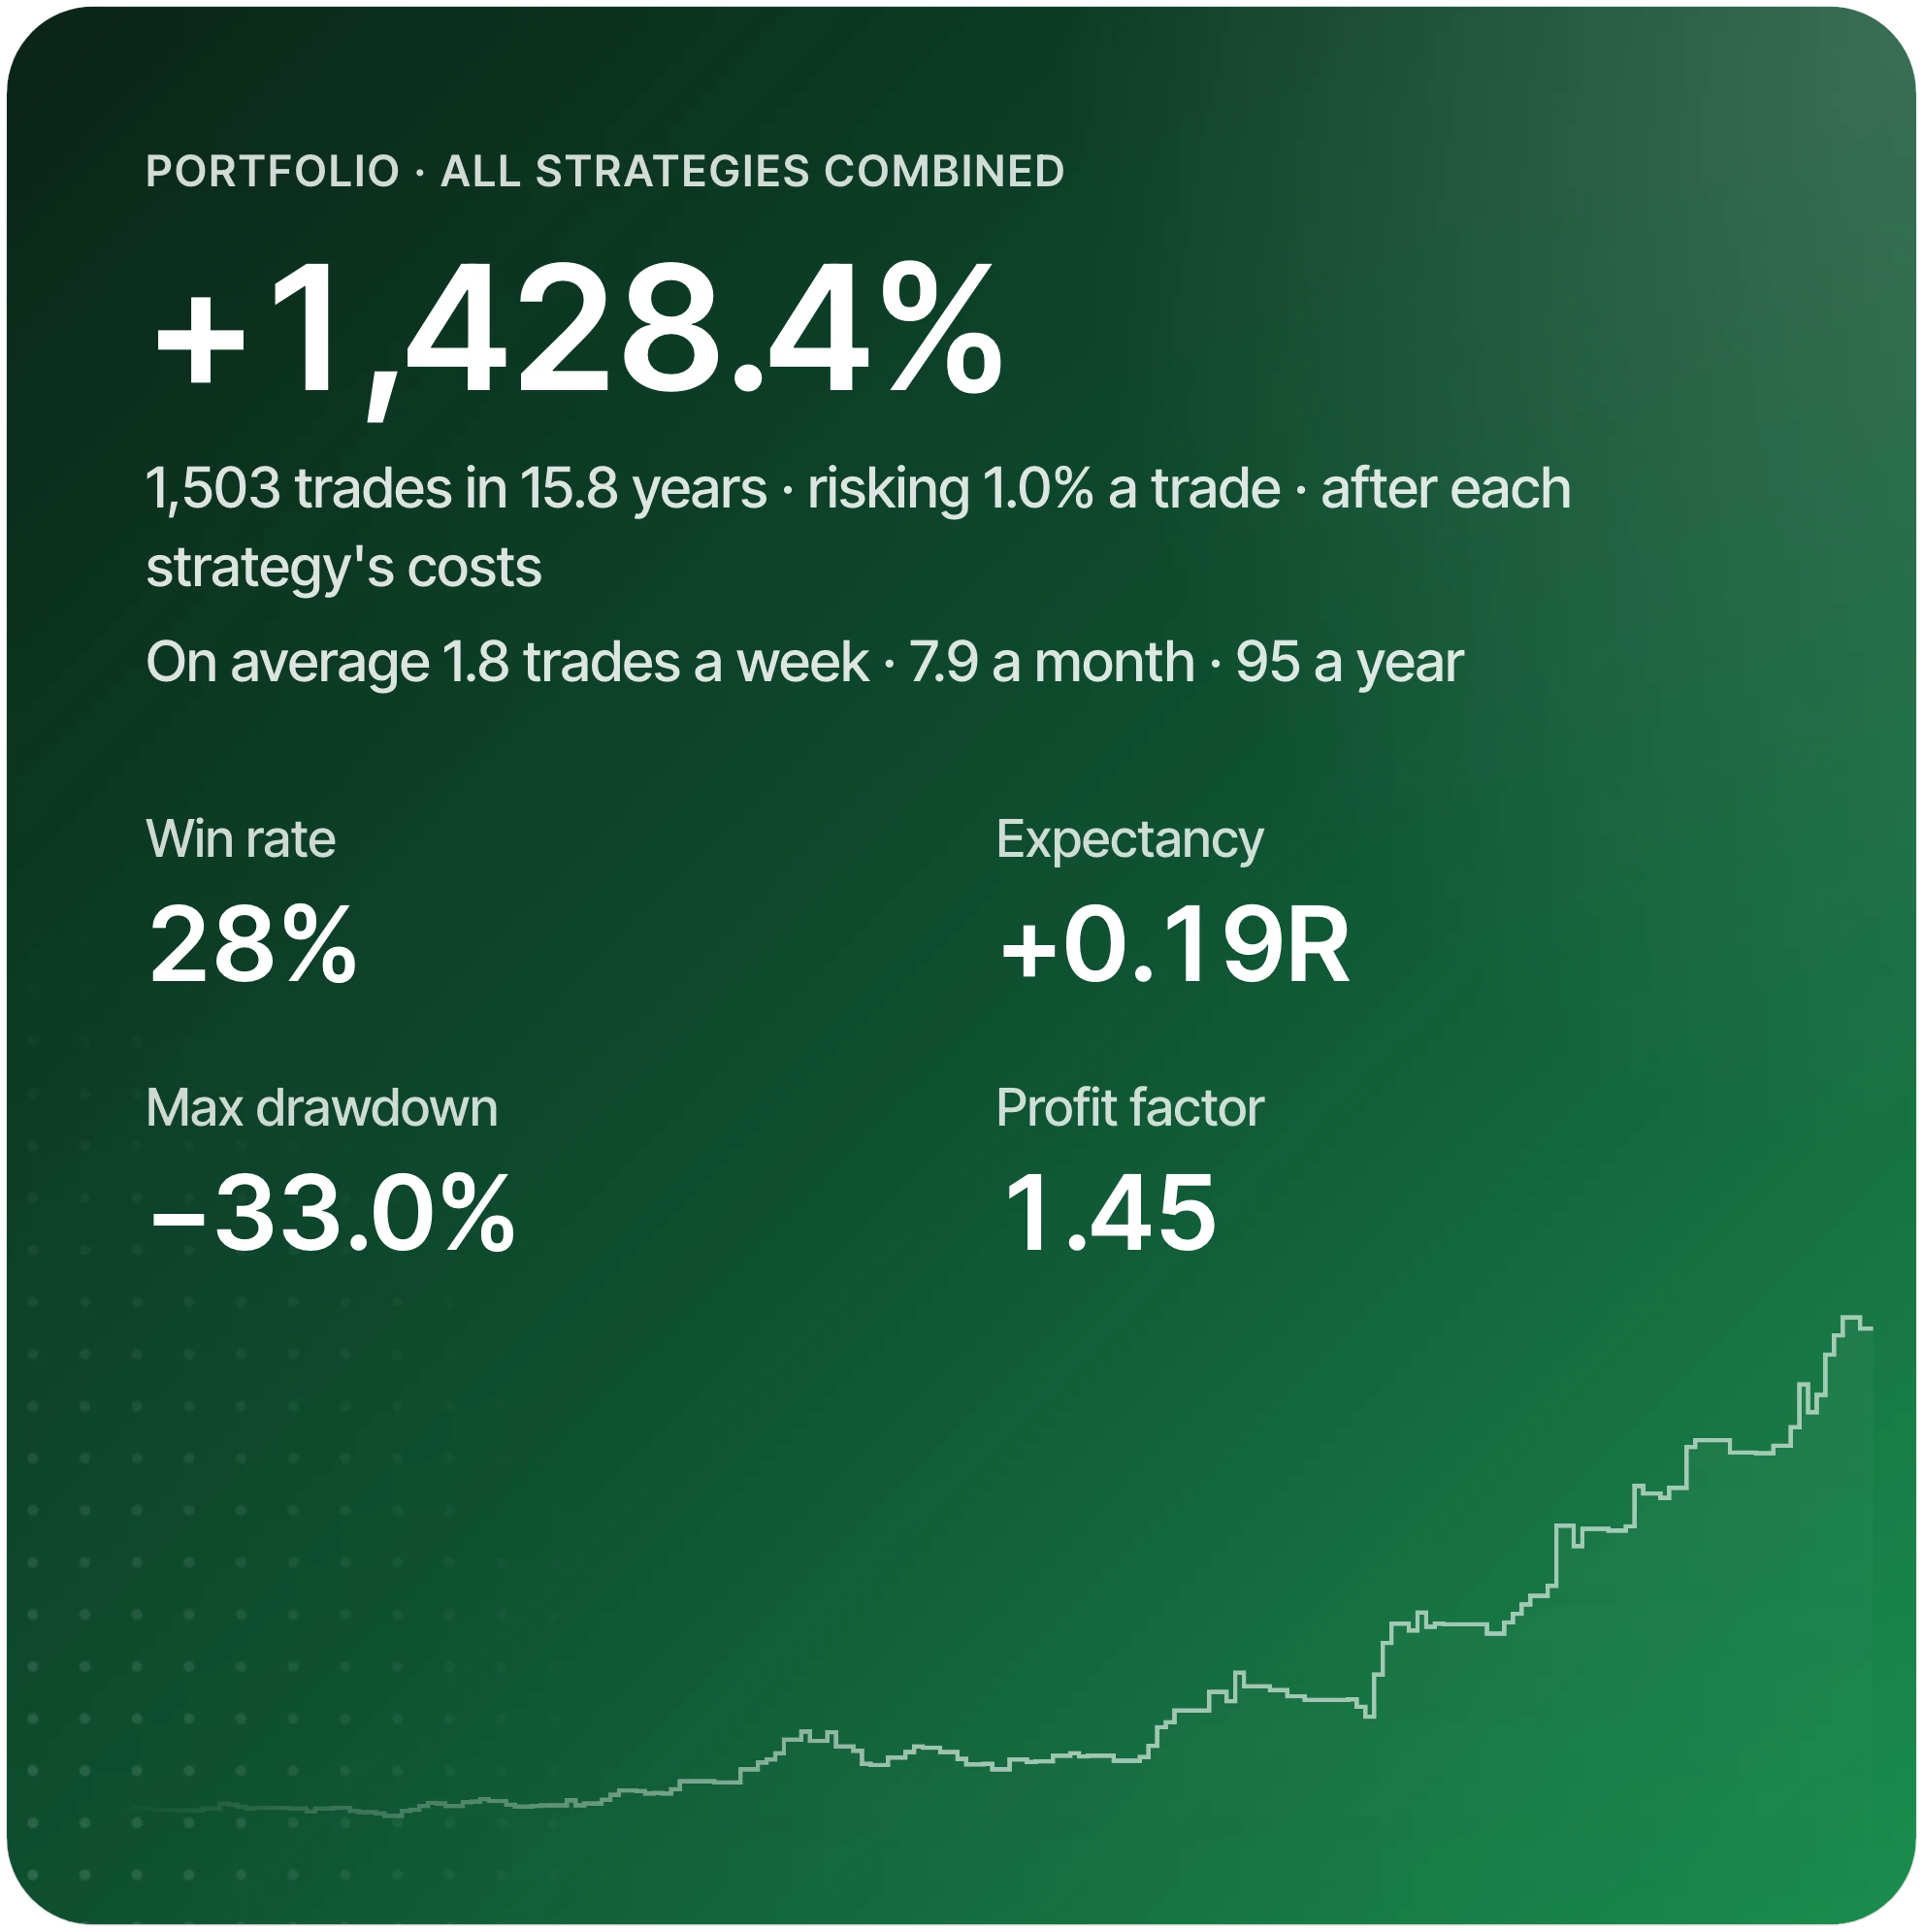
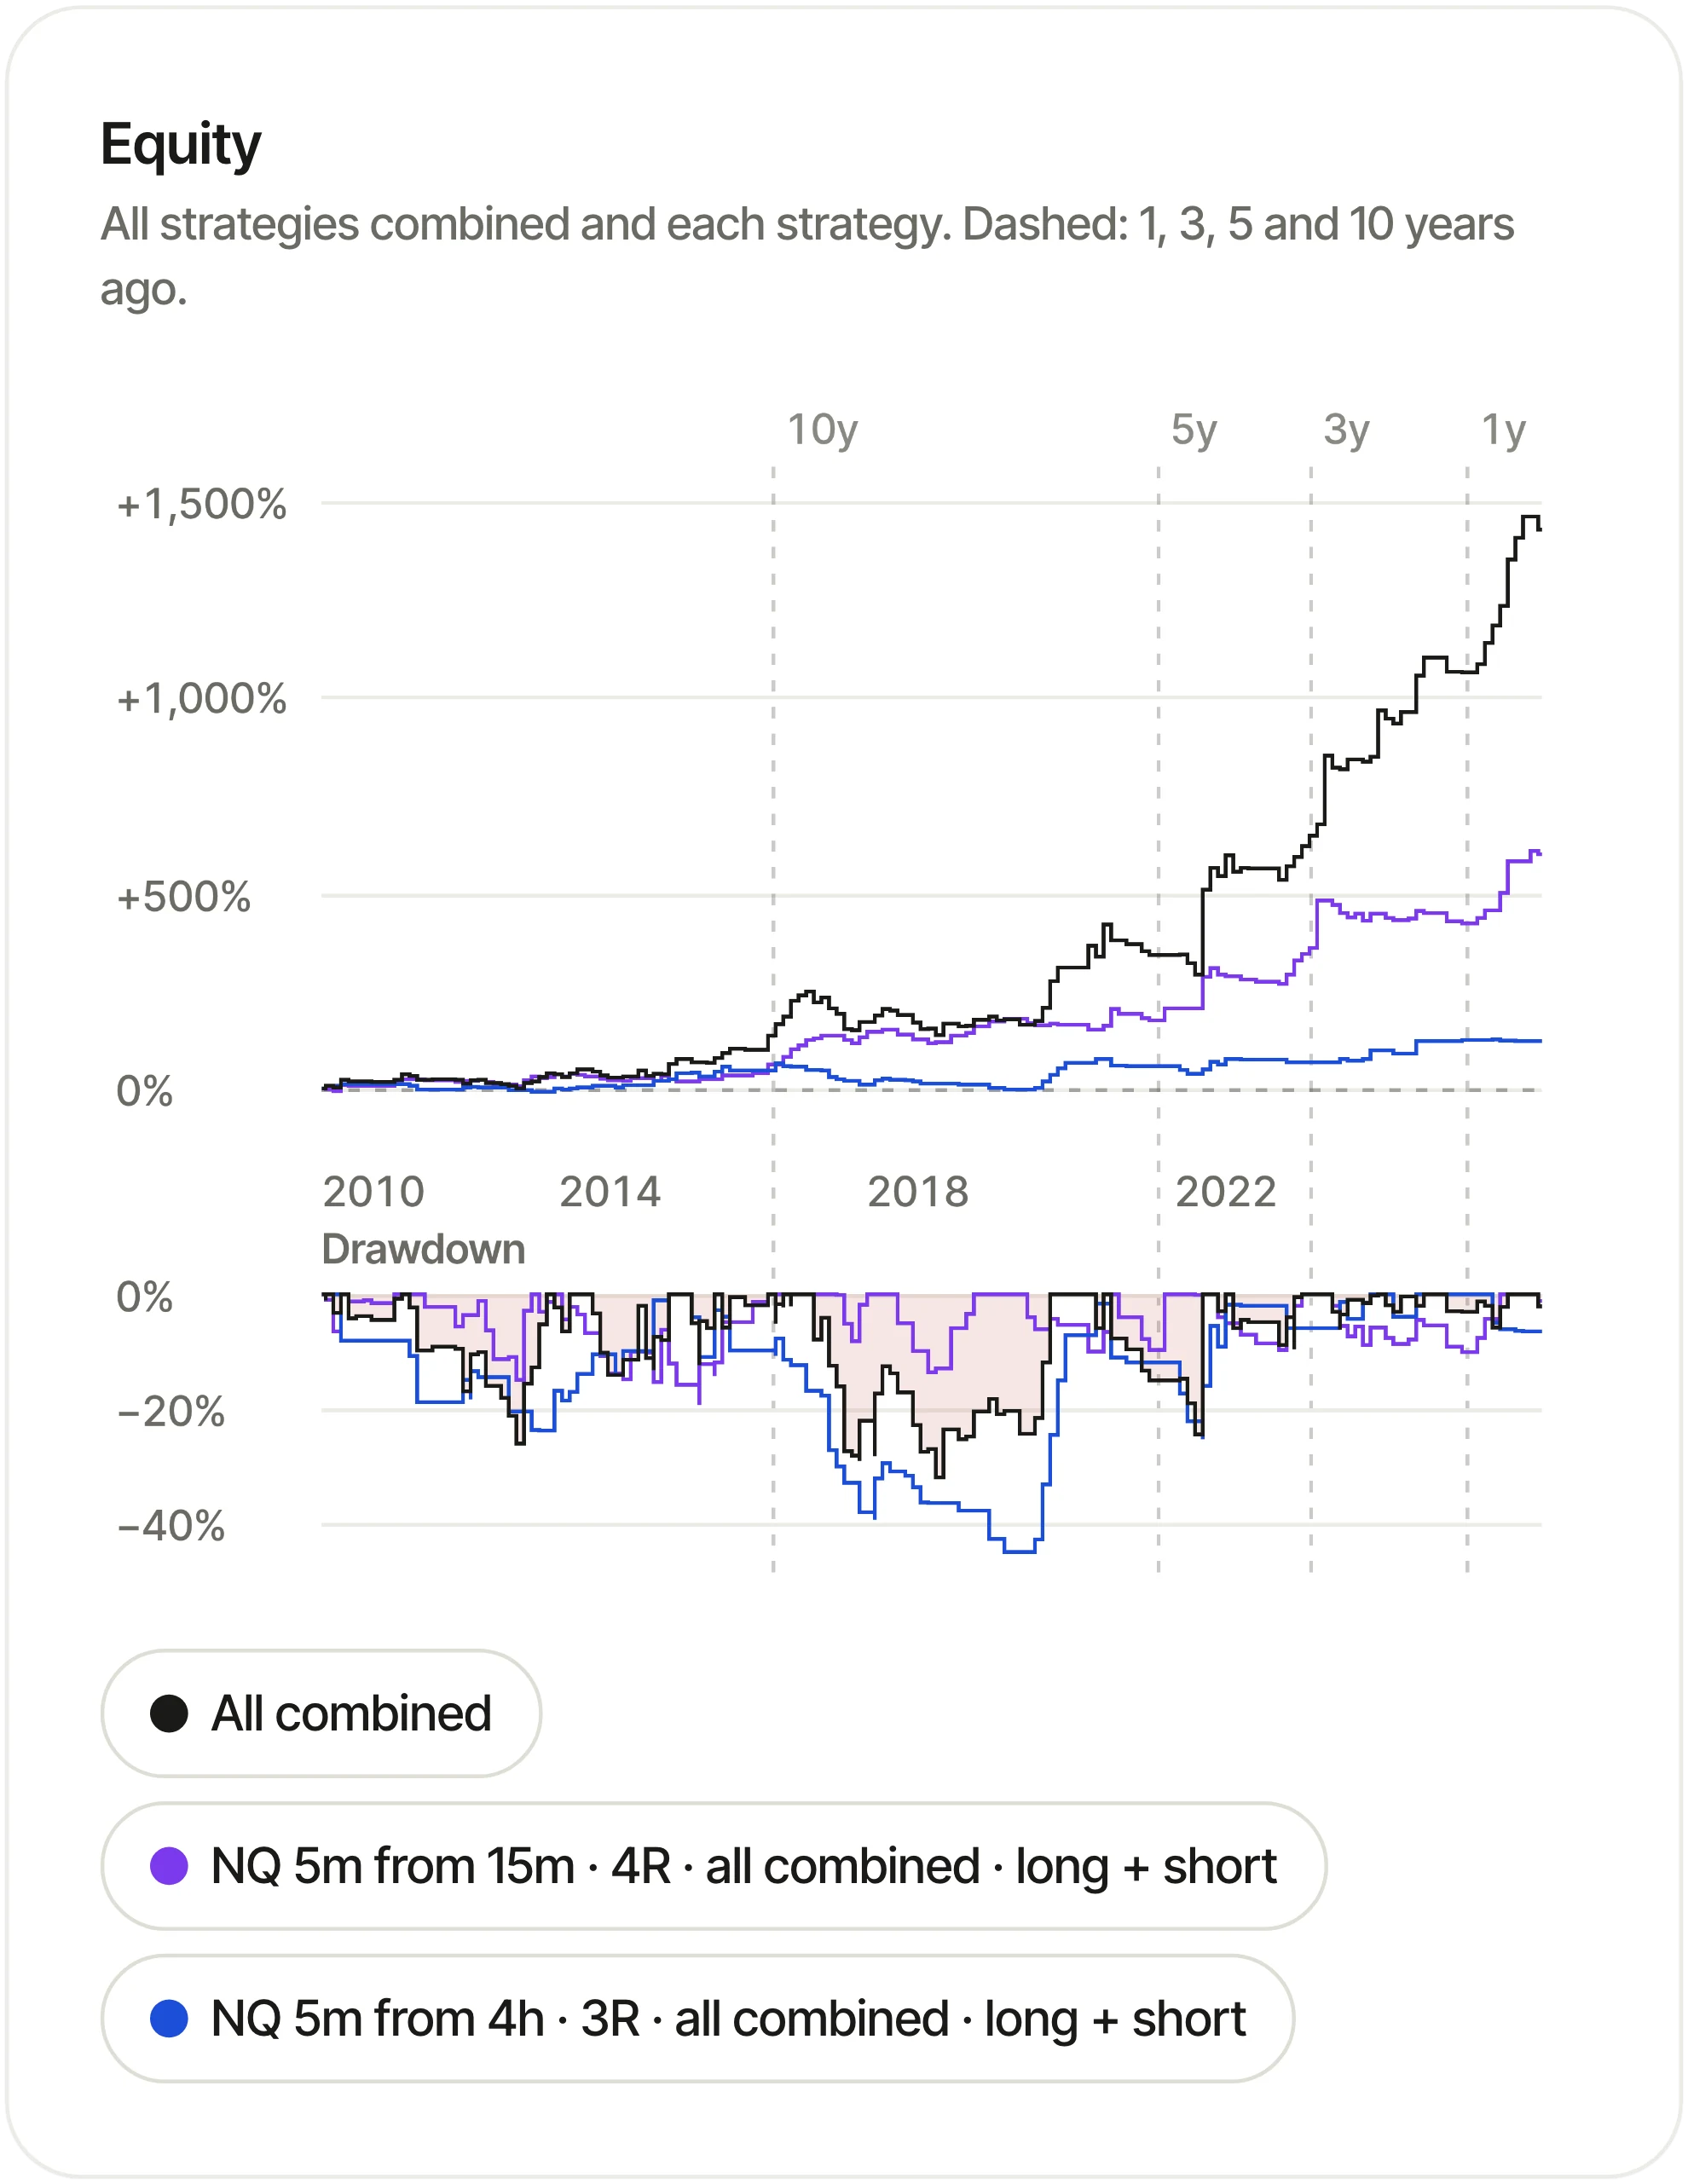
Simulated results on historical data. Portfolio of two NQ strategies: 5m entries from 15m IRLs with a 4R target (standard, long and short) and 5m entries from 4h IRLs with a 3R target (standard short). Compound at 1% risk a trade, Dec 2010 to Oct 2026, costs on. Past results do not predict future results.
79 markets across futures, CFDs and forex.
The data is updated every month. So you can come back and check that a strategy still behaves the way it did on more recent data.

No card needed. Or see the plans.
The same strategy, on your live charts.
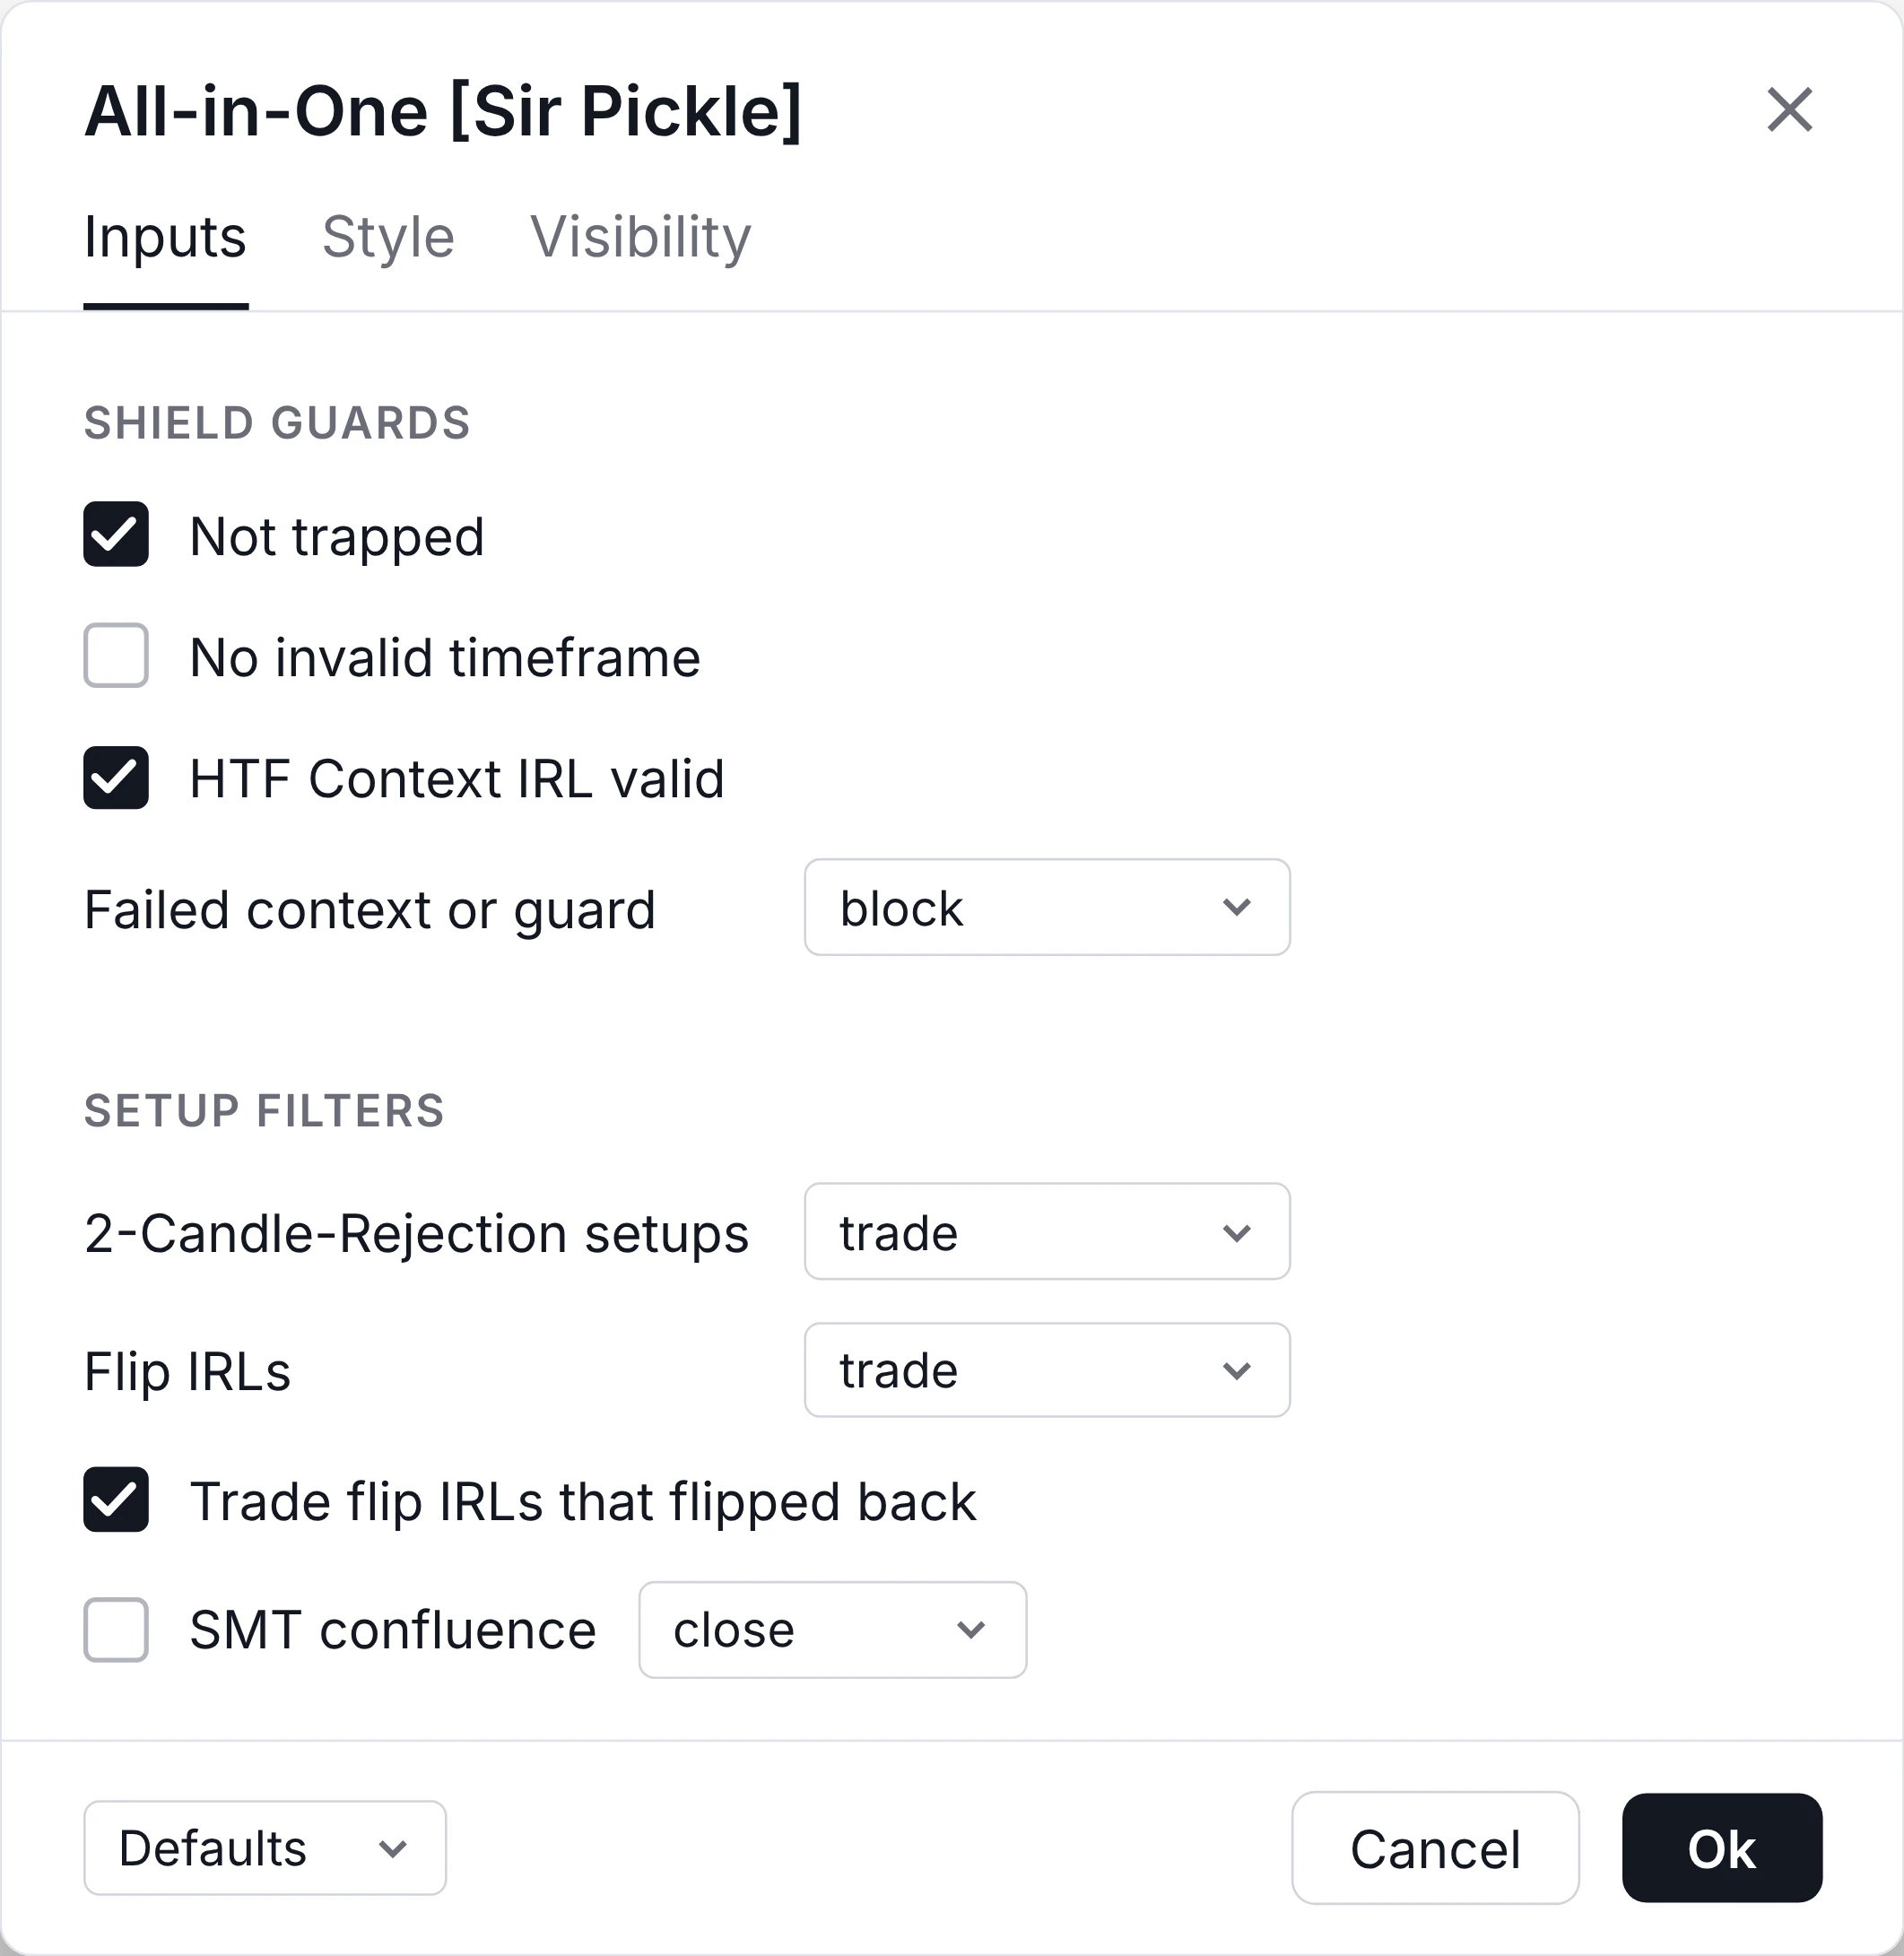
My All-in-One indicator uses the same rules as the backtester. You set the same settings up in the indicator, and it marks the setups of the strategy you backtested right on your live charts.
See the All-in-One indicator
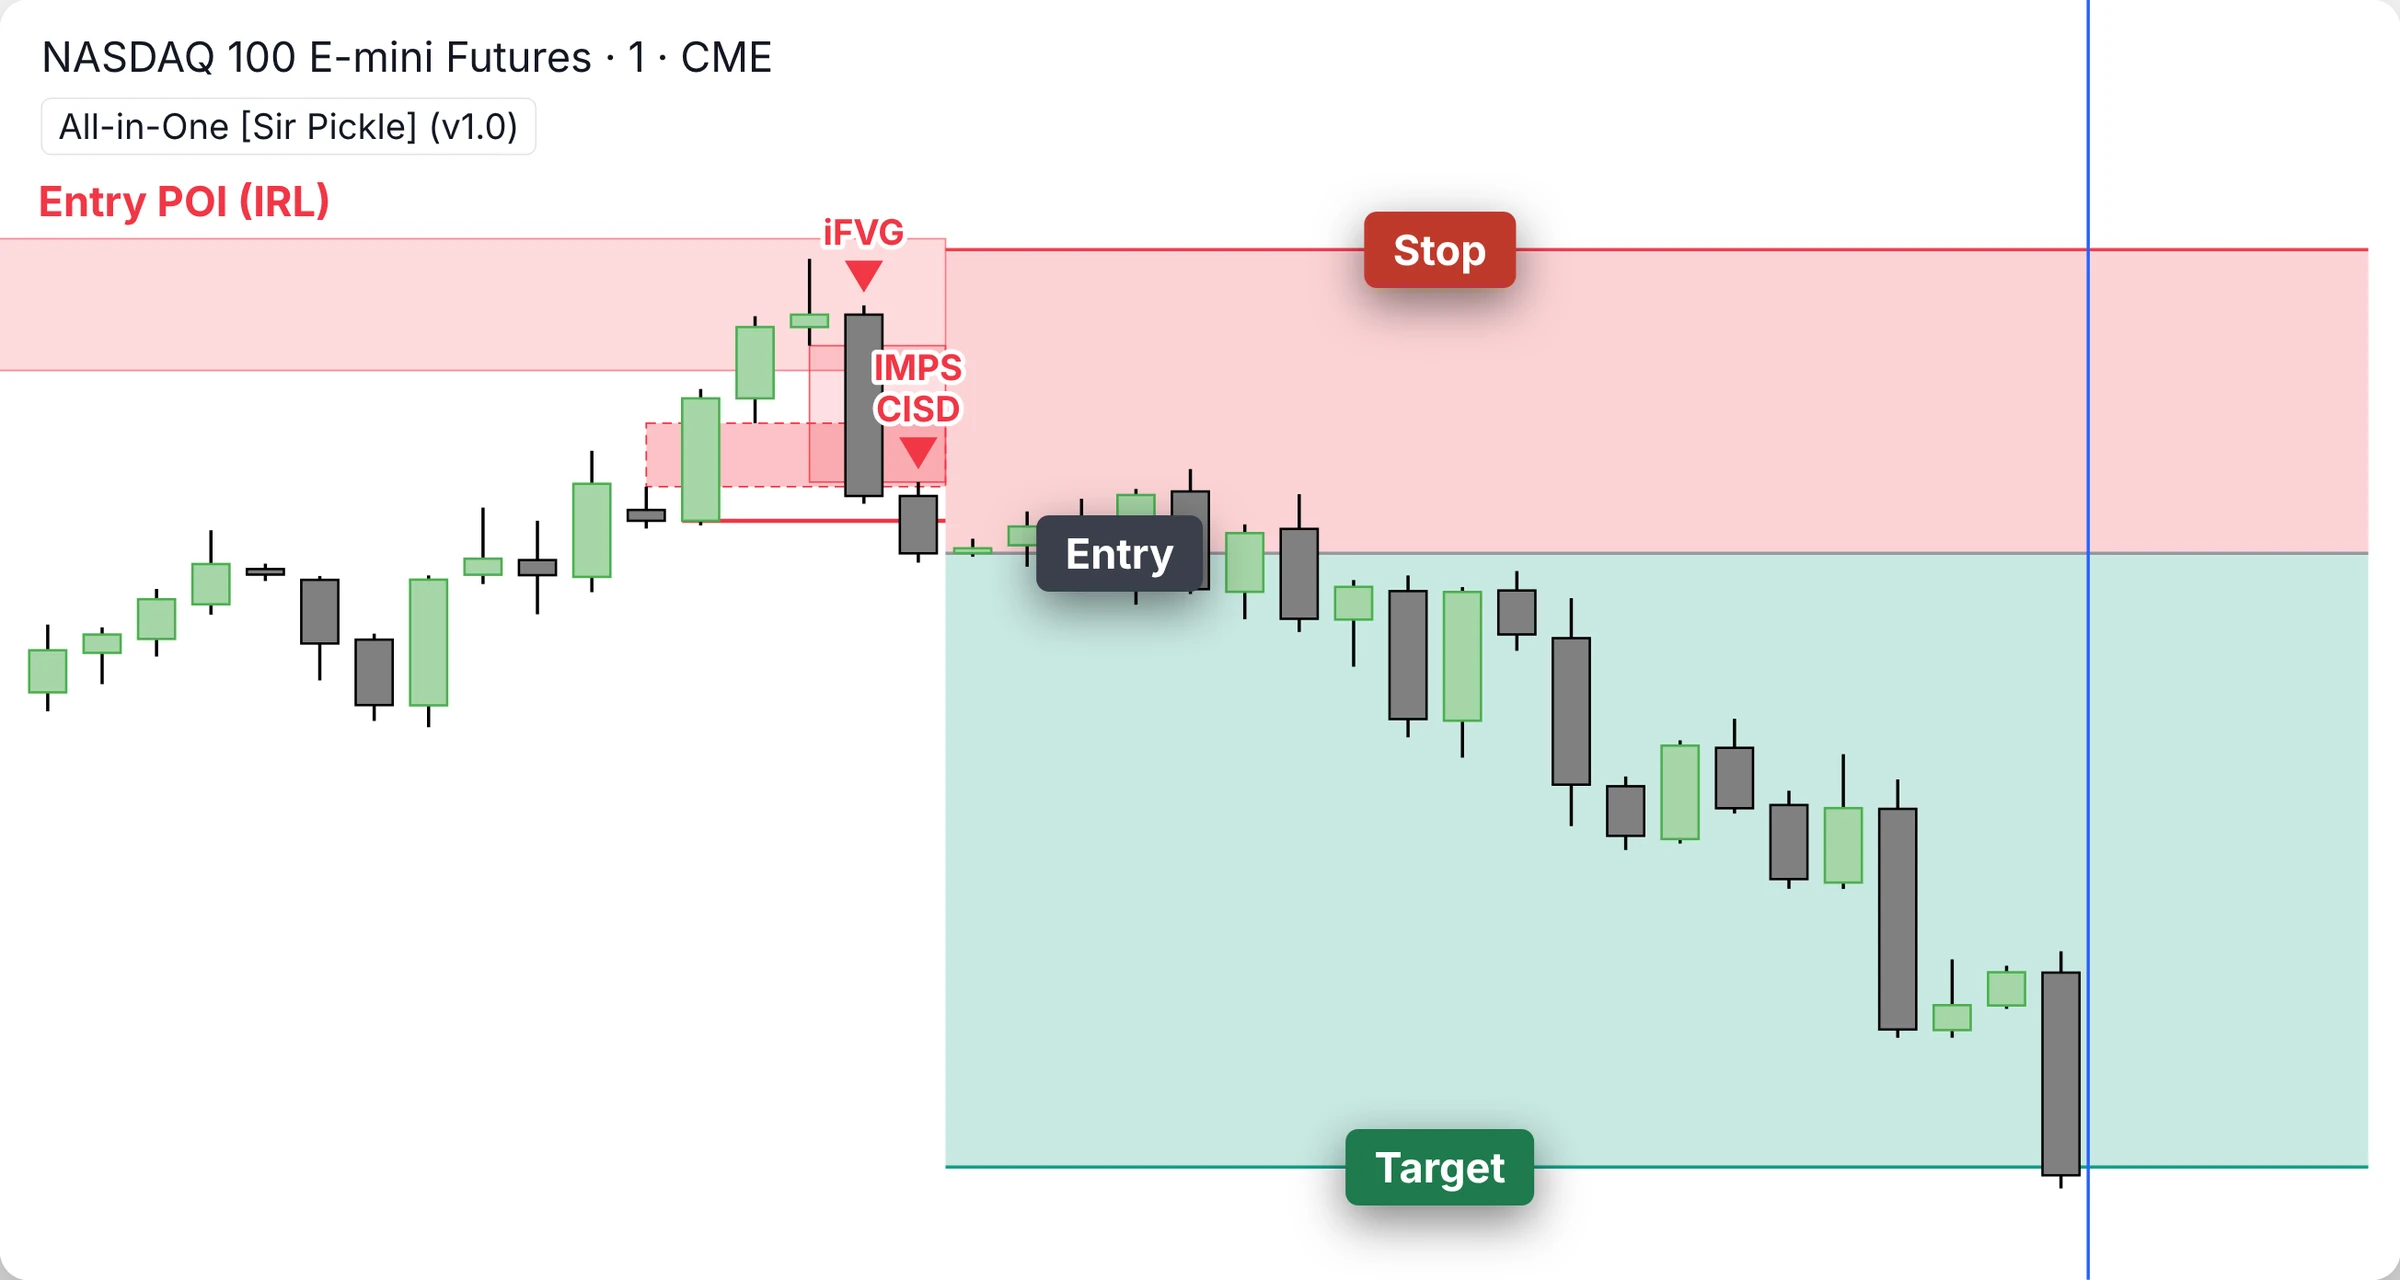
Backtest your strategy on any timeframe from Daily to 1-minute, with up to 22 years of data. No card needed.
Try one backtest for free- Instant backtests of your exact trading strategy
- Up to 16 years of futures data, up to 22 on forex and CFDs
- 79 markets, updated every month